- Docs
- Snapshots Overview
- Creating Snapshots
-
Installation
 Updating
Settings
Logs
Updating
Settings
Logs
- Using ItemPath
-
API
Reports
Snapshots
Workflows
Dashboard
Explorer
Users
- Apps
-
Cycle Counts
Data Pull
Data Push
Displays
Lights (Philips Hue)
Custom Fields
Creating Snapshots
Once you have a report, you can add a Snapshot to
- gather the data by specified time slices
- consolidate the data by groupings
- present the data visually in a graph or totals
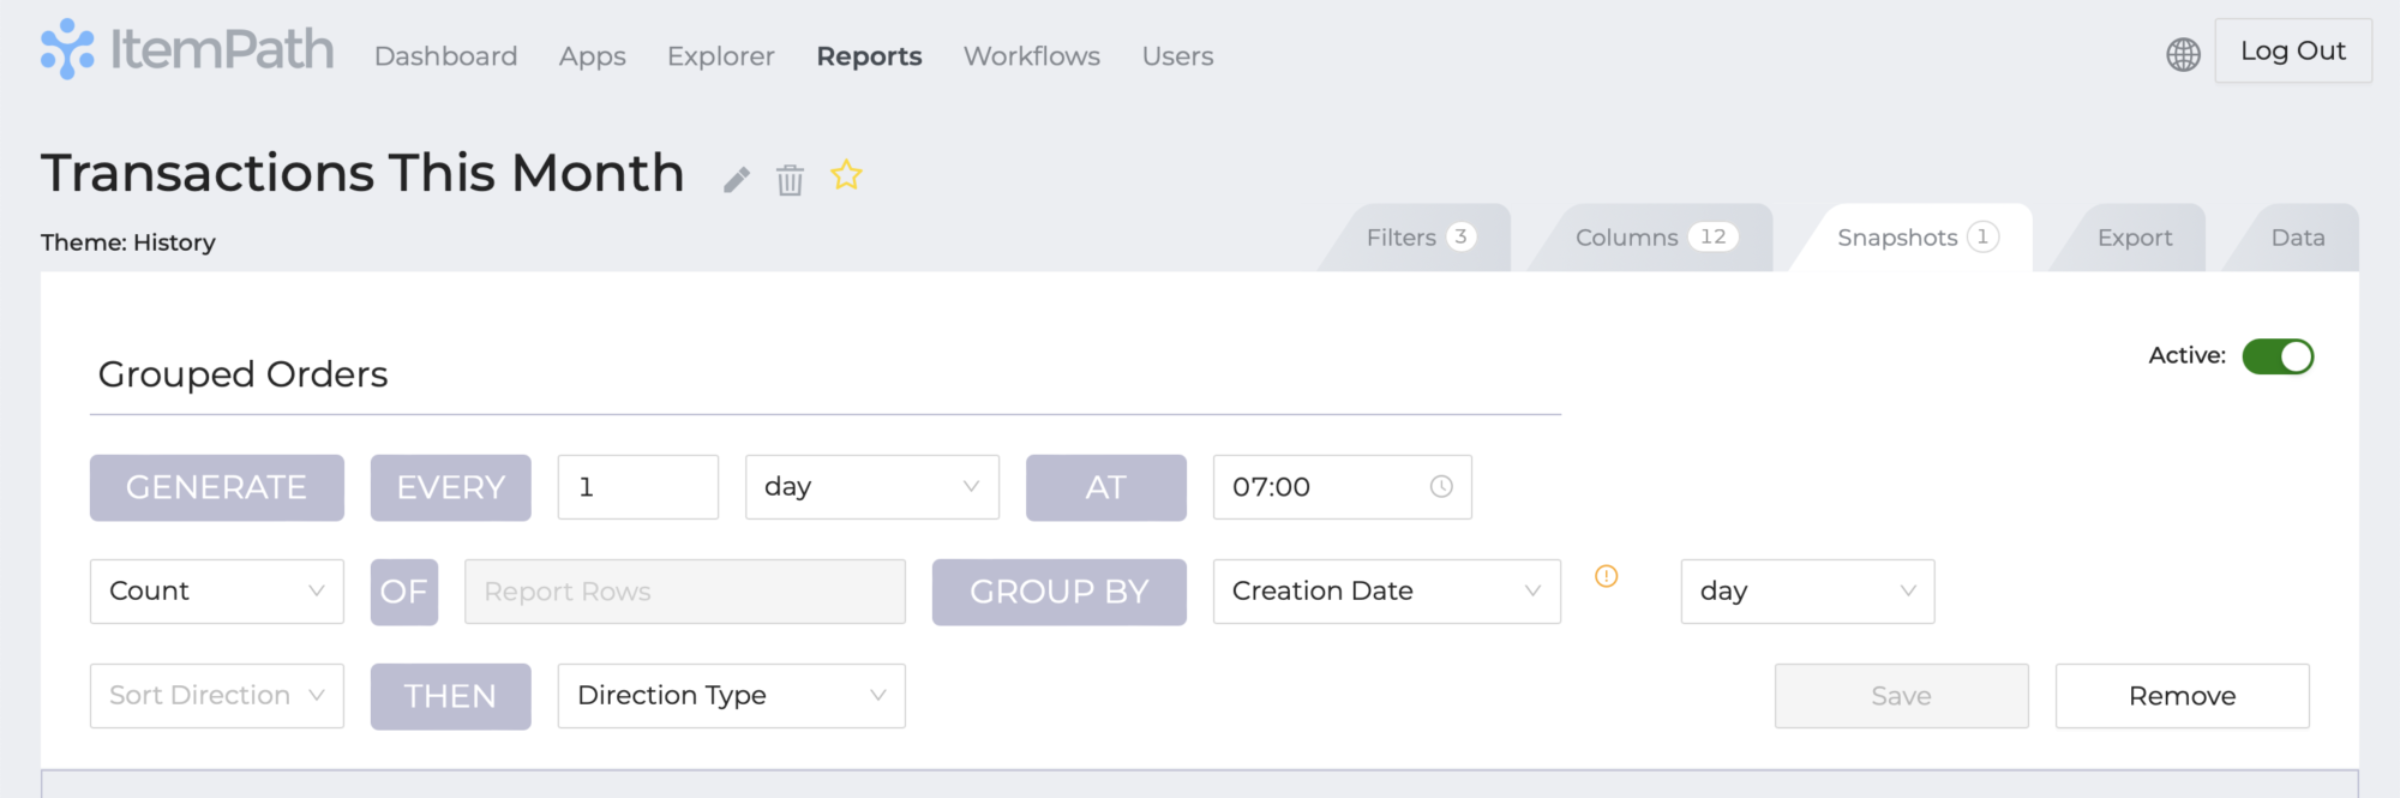
Using the image below, we'll take you through the steps of creating a Snapshot.
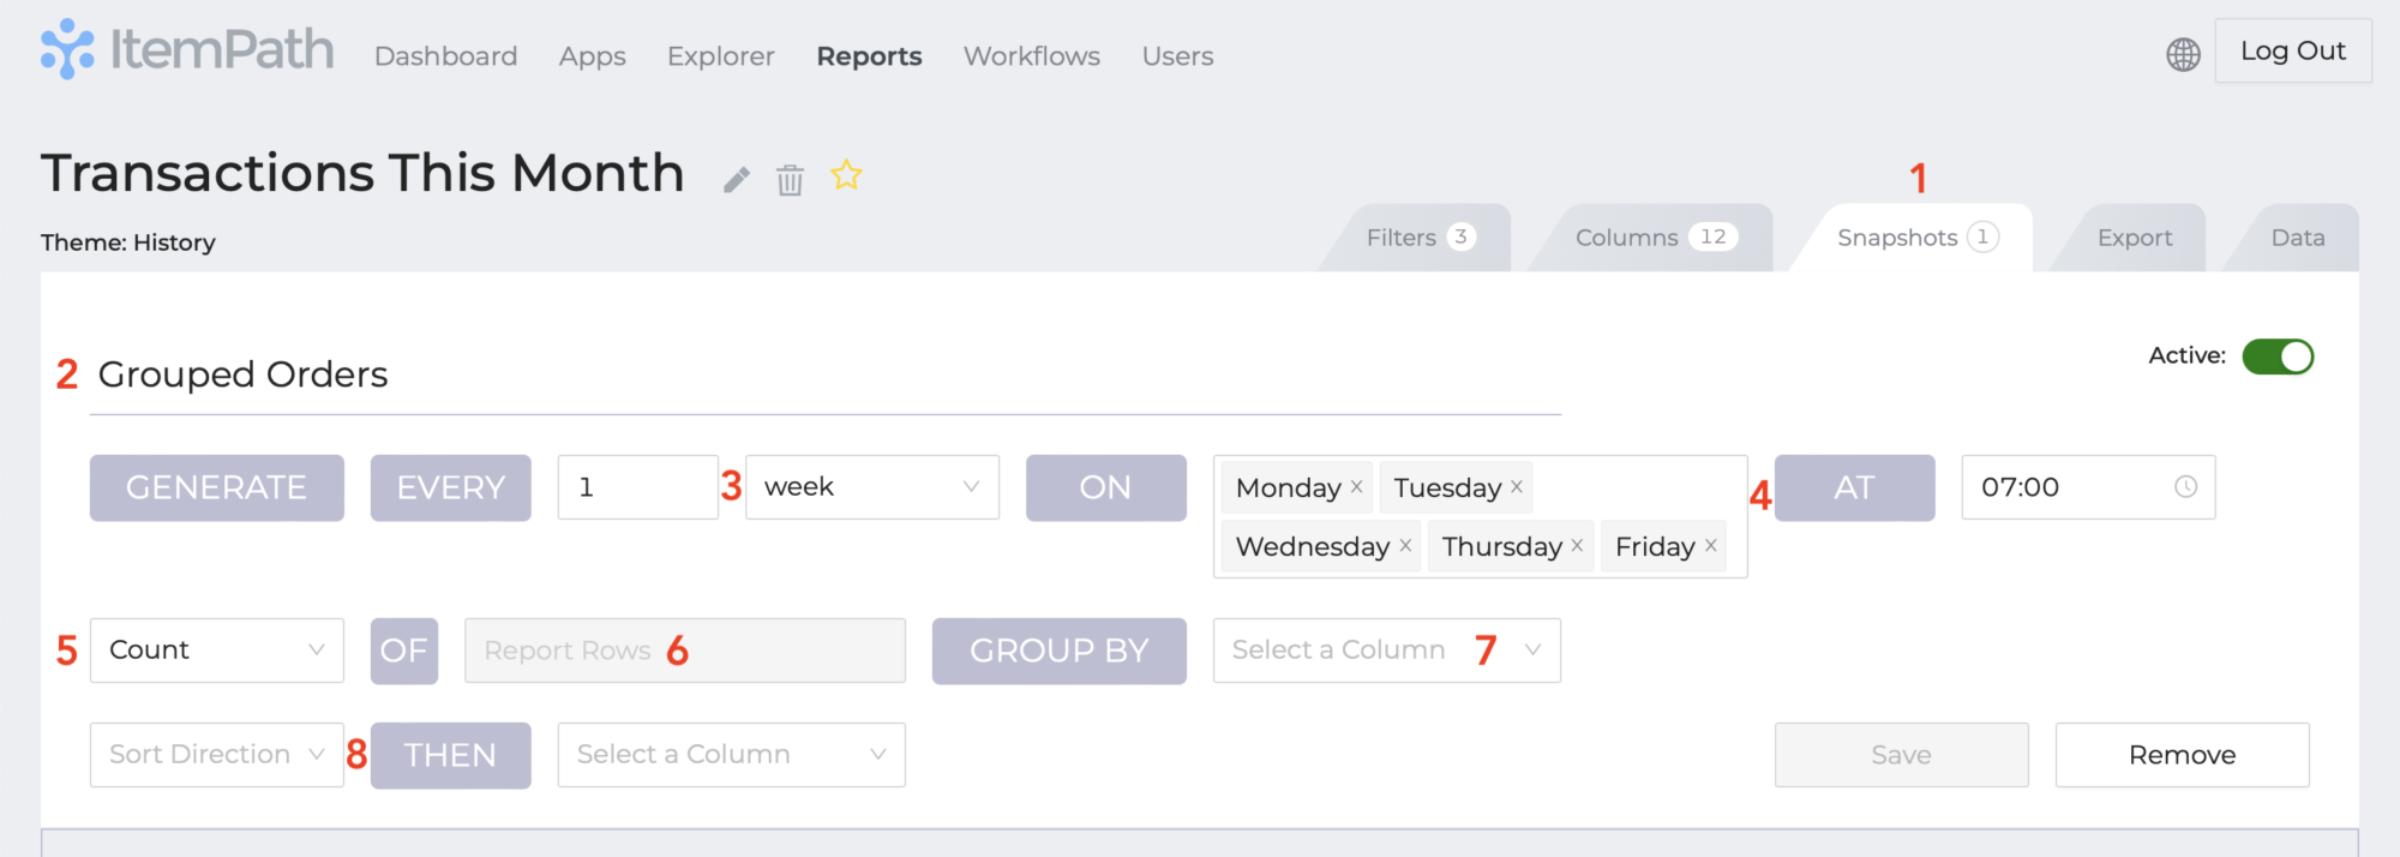
1. In your Report, click the Snapshot tab.
2. Give your Snapshot a name.
3. Decide what time frequency to base your data time slices on.
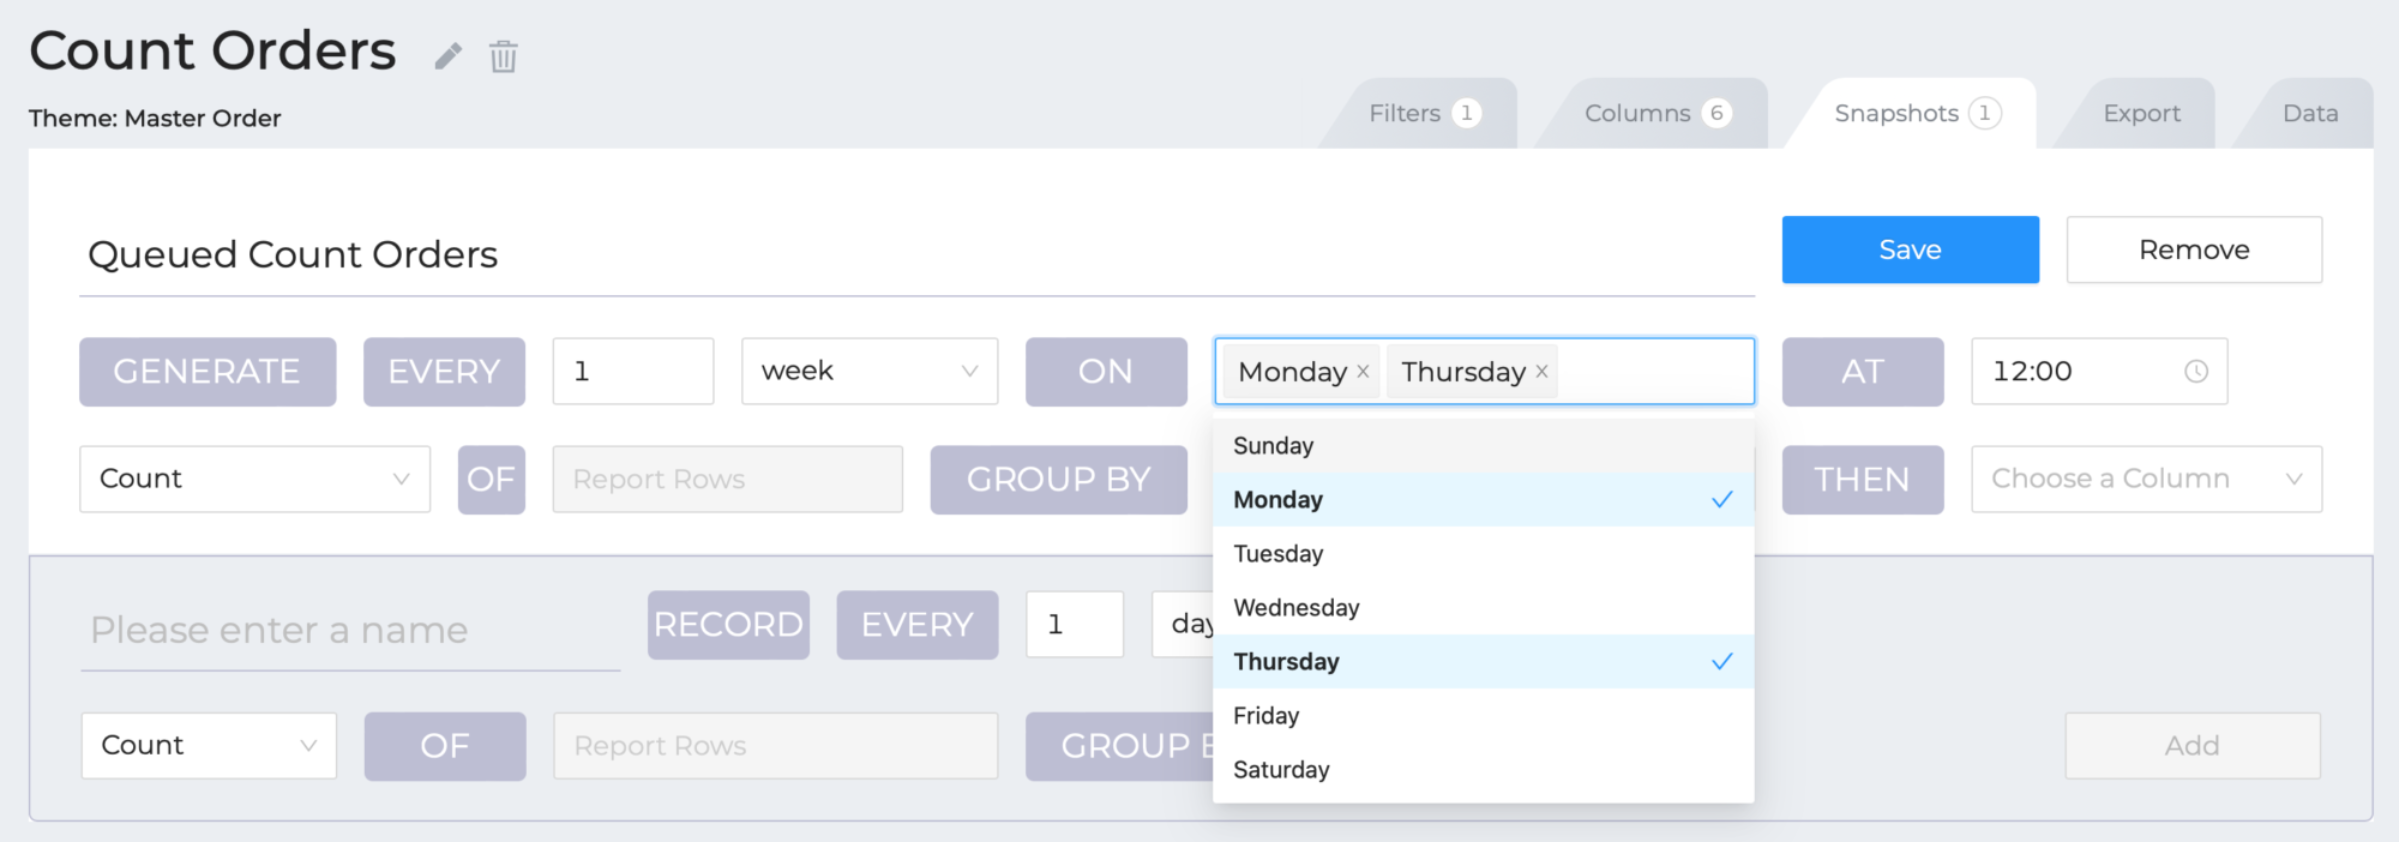
4. Depending on the frequency you choose, you can set the time of day, days of the week, and/or day of the month
5. Pick from Count, Sum, Average, Minimum, and Maximum.
6. If "Count" is selected, all "Report Rows" are counted. Otherwise, choose the report column to perform the Sum, Average, Minimum, or Maximum calculation on.
7. Optionally group by one of the Report columns, and optionally select Ascending or Descending.
8. Optionally choose a second column to group by.
Save your Snapshot.
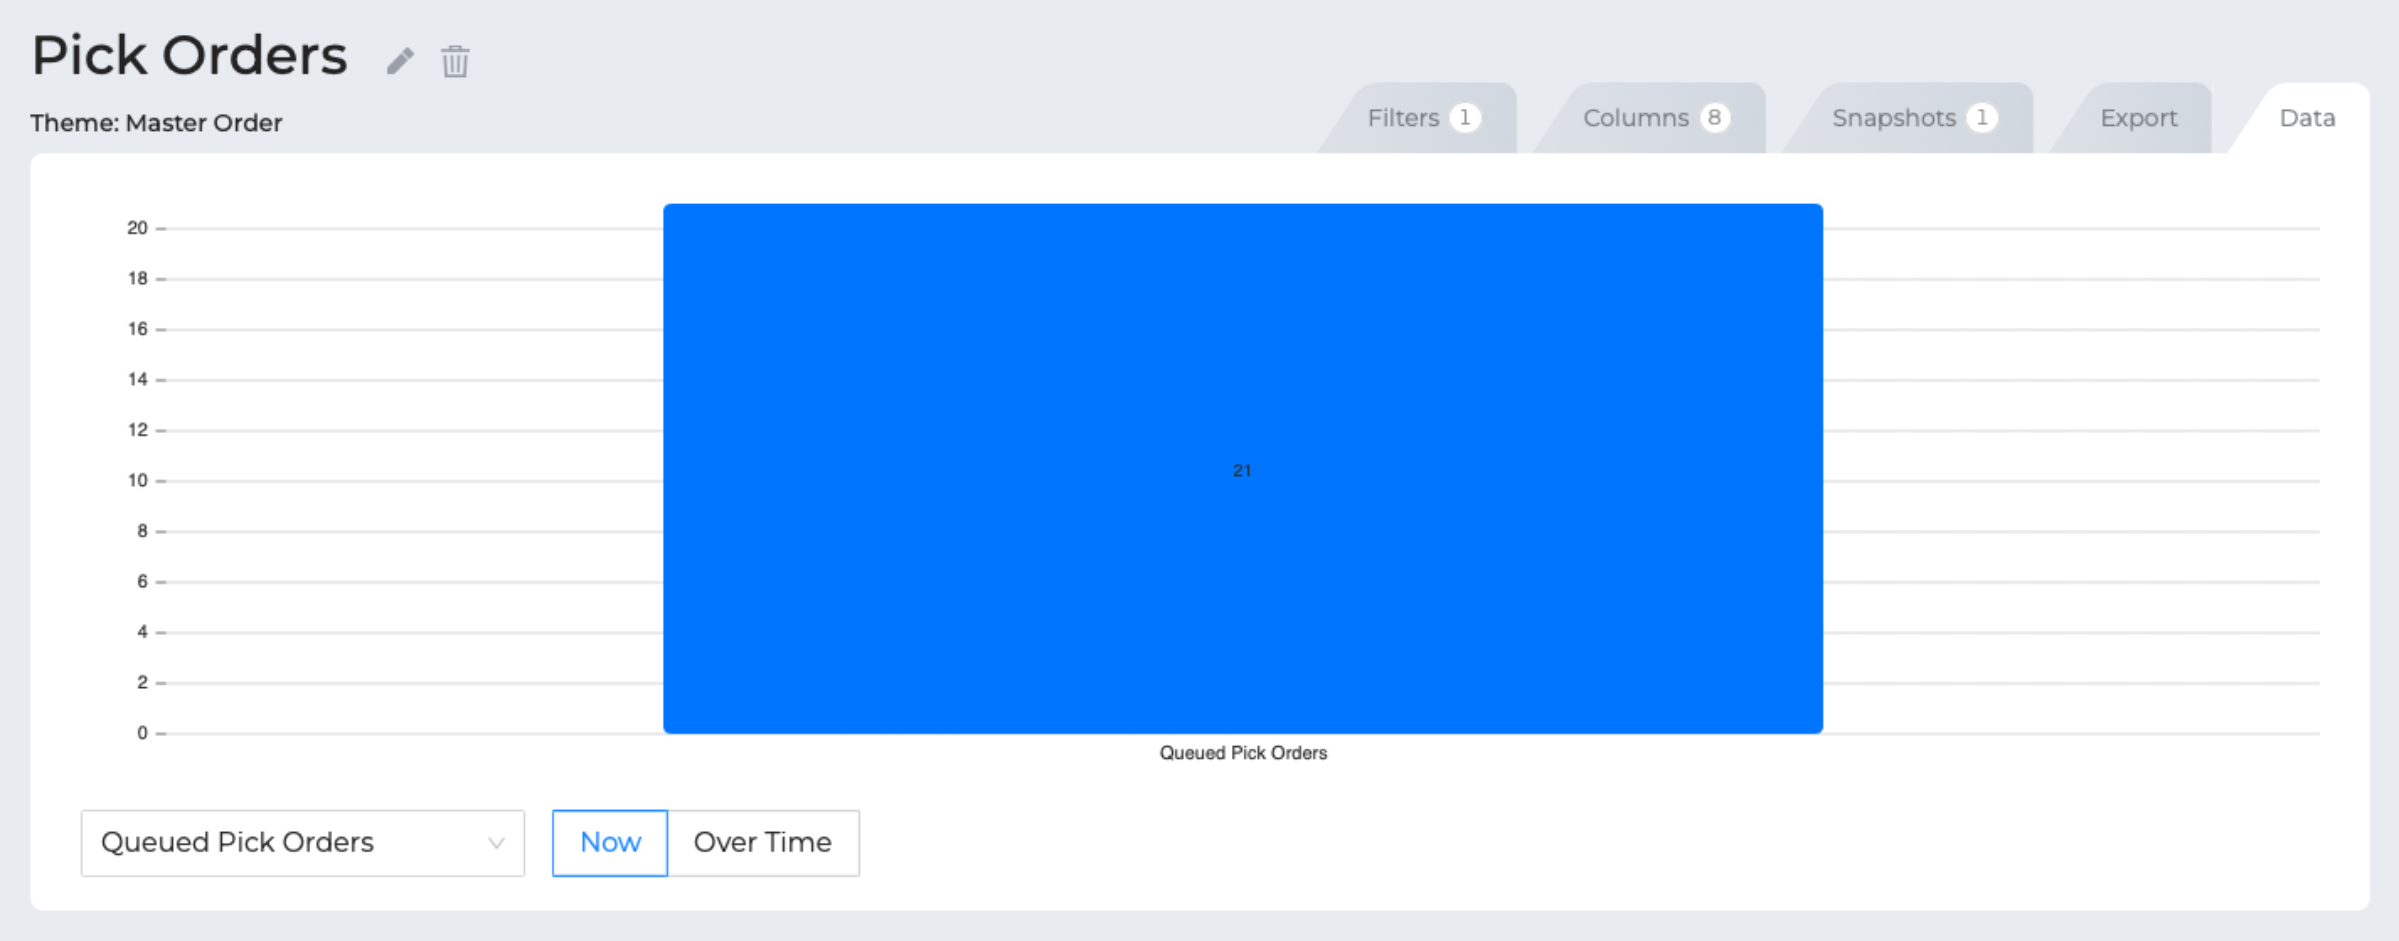
It will then be available to display the results in
- the Data tab in Reports: Choose the Snapshot just above the Report results (see the dropdown at the lower-left of the image below)
- Dashboard widgets.
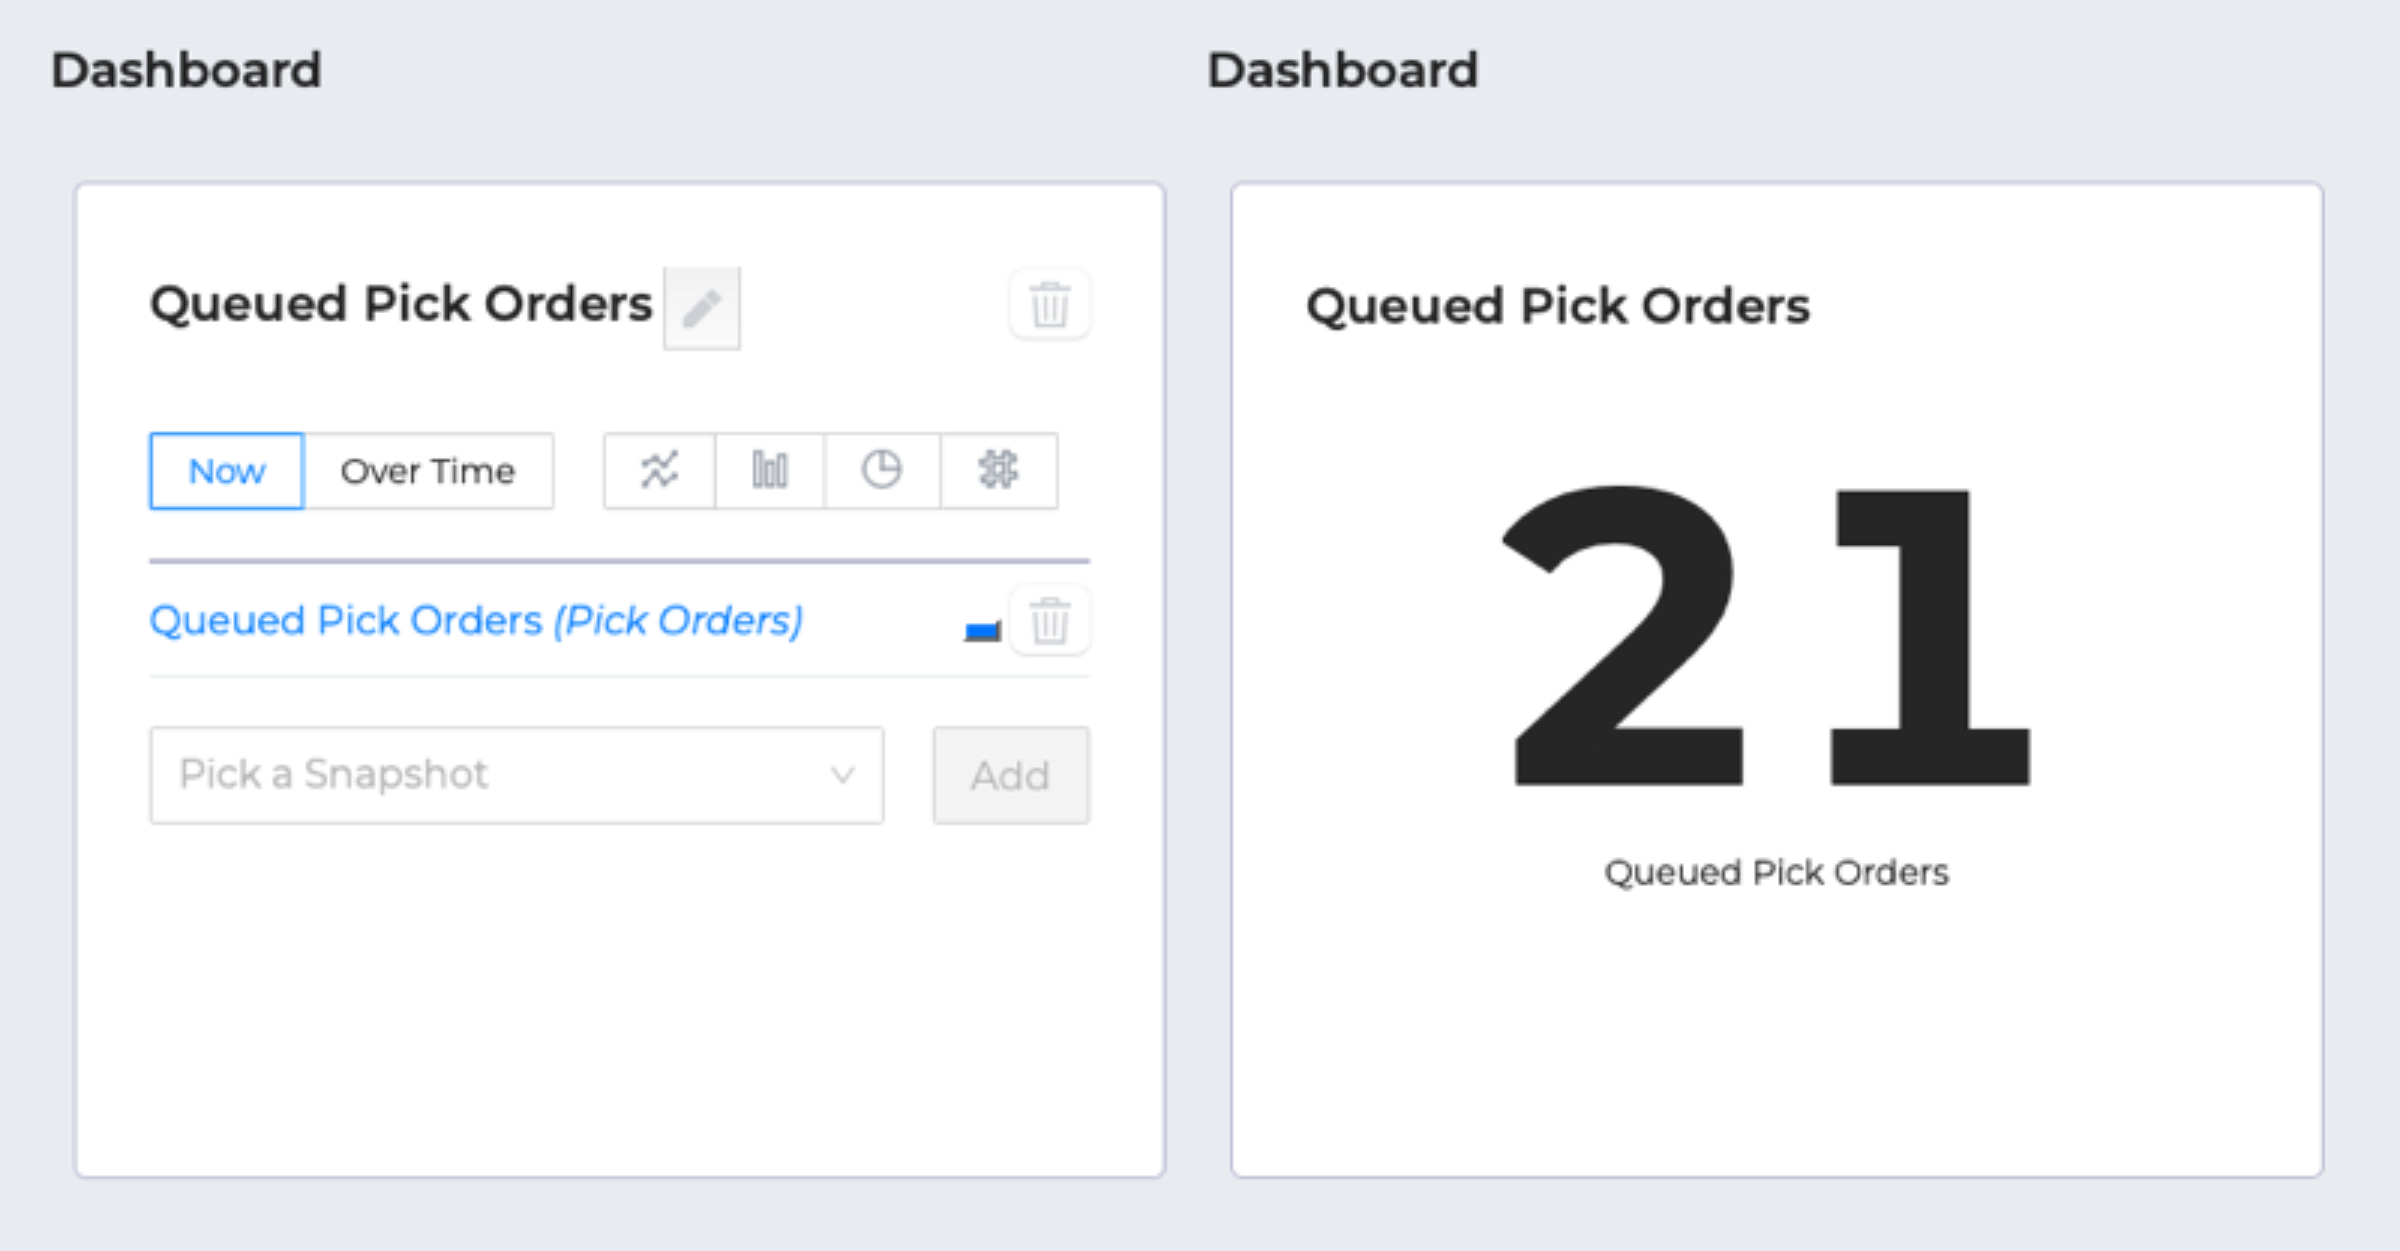
Adding this Snapshot to a Dashboard widget with the following settings will display the resulting image. You can add multiple Snapshots from multiple Reports to a widget for comparison. In this example, you might also want to show the quantities of put and count orders in the queue.
For snapshots with a secondary grouping, the widget chart will show quantities grouped by two values, depending on what's selected. A common choice is to group by Creation Date and a secondary value, though this will show a warning that grouping by Creation Date for many snapshots can begin to slow ItemPath down.
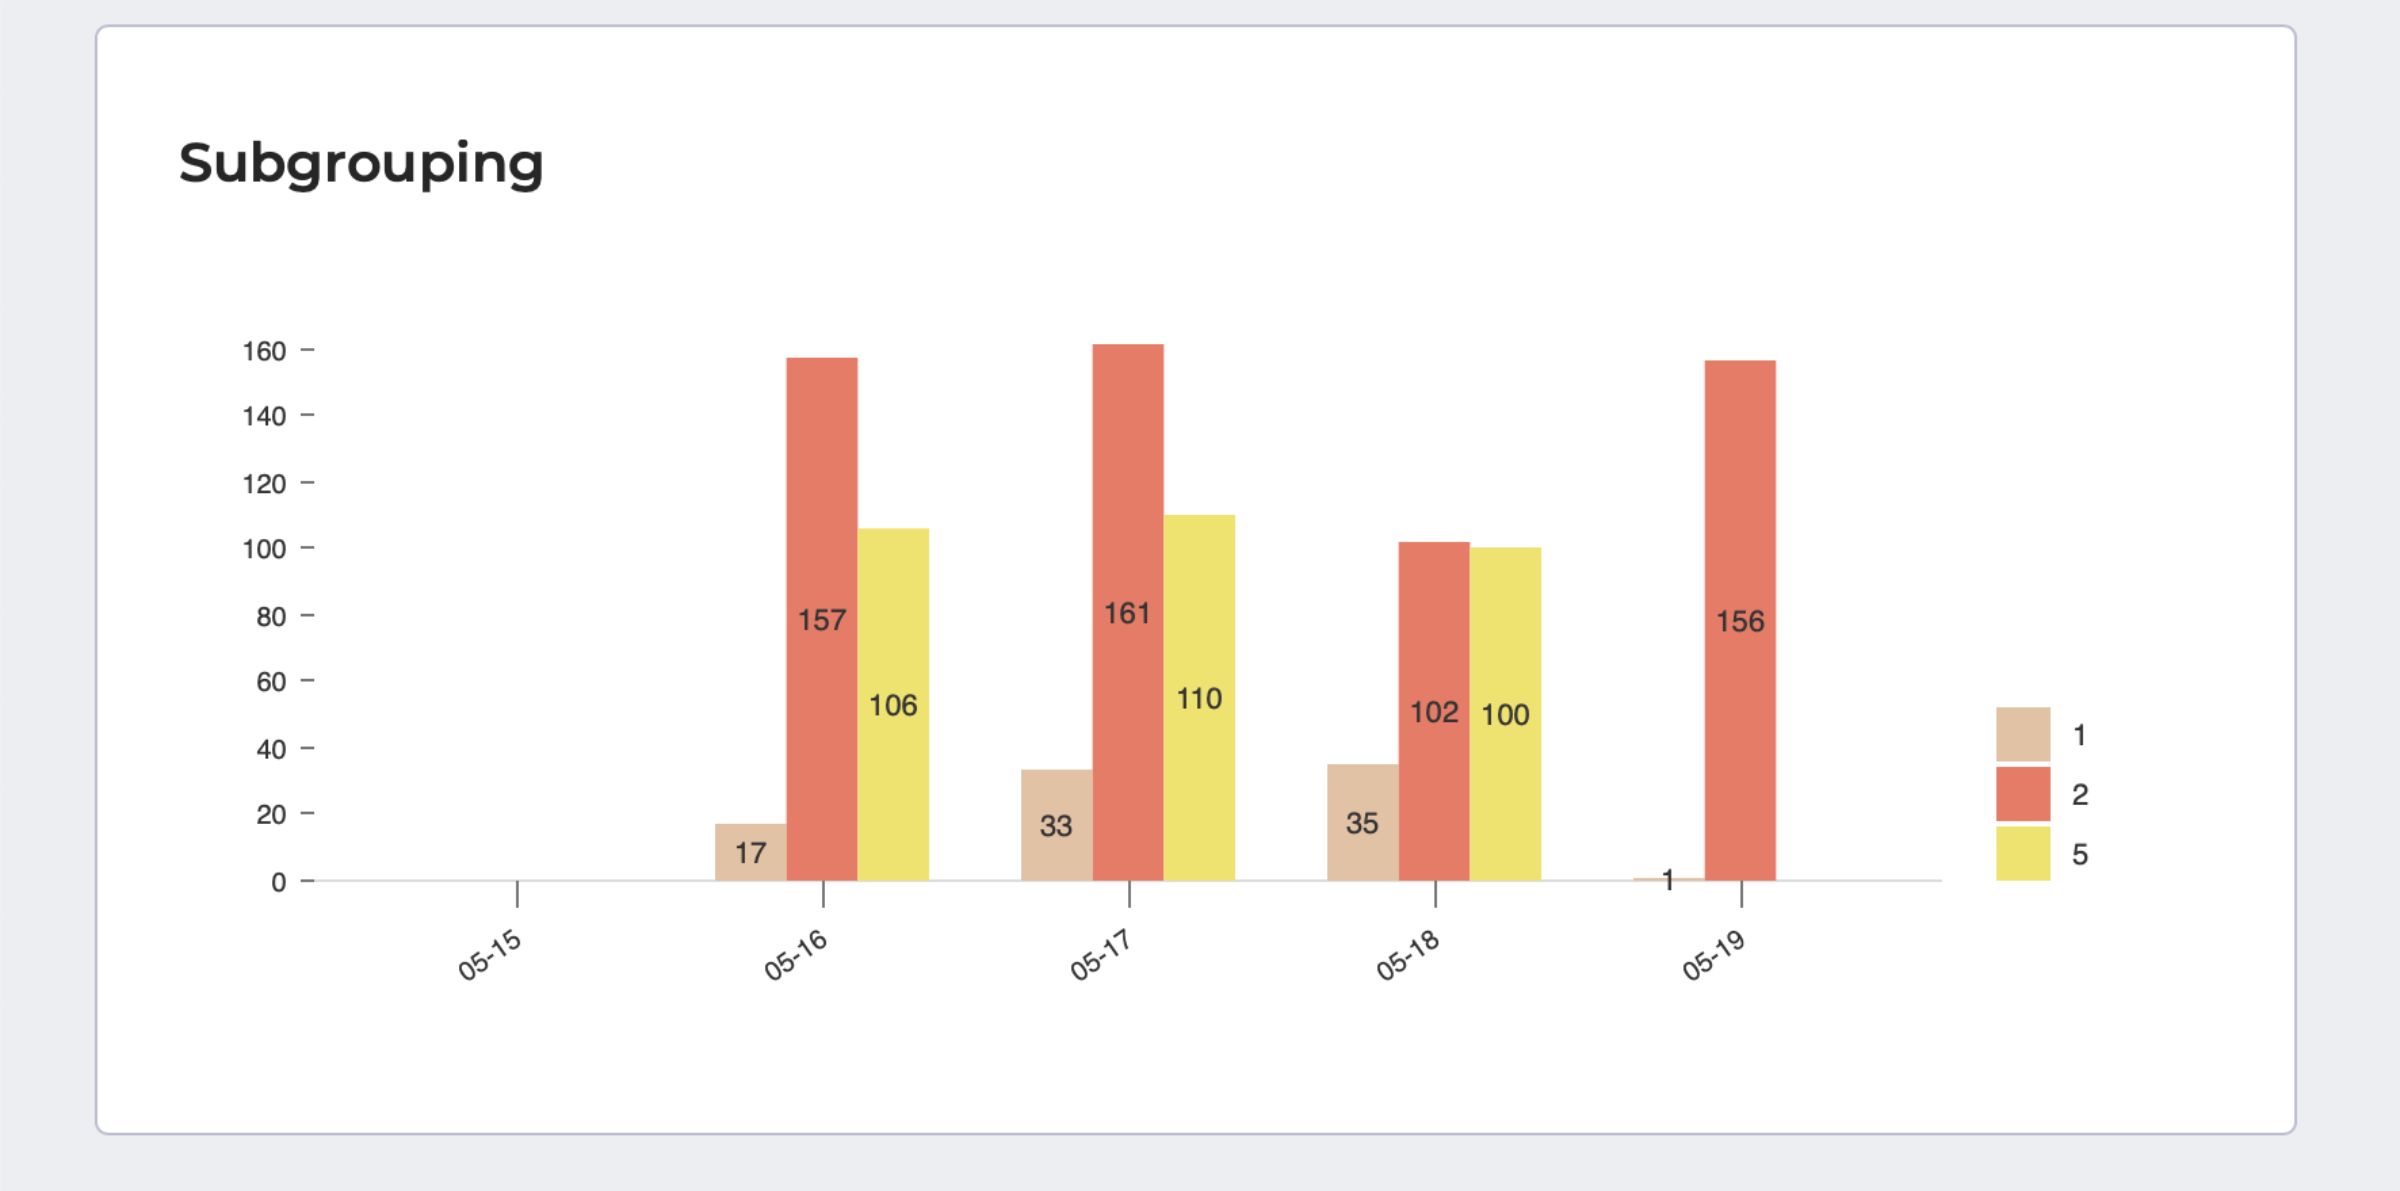
Here are the snapshot settings for this widget.