


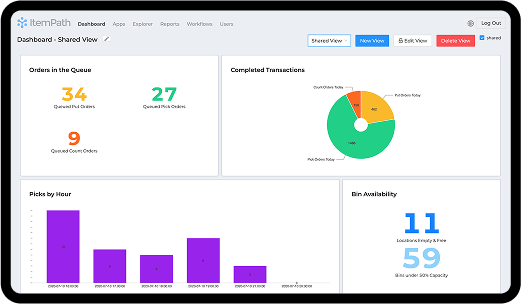
Dashboard
Get instant visibility of crucial updates
Check target and trend lines
Choose from a variety of colourful graphs and charts to create custom widgets.
Make your data easy to understand at a glance so you can pick up on patterns and outliers. Use ItemPath's "snapshot" reporting technology to measure growth over time.
Watch for things like:
- Storage space remaining
- Processing frequency
- Stock quantities
- Counts due

Share with your team
Allow varying levels of access to any number of users so everyone can be on the same page.
Display the dashboard on a public monitor or tablet and allow users to log in securely from wherever they are - toggling between different views.
Motivate the team by highlighting the impact of their role on the overall statistics of the warehouse.
Tell a visual story
Get instant visibility of crucial updates on orders and inventory by monitoring live data. Display graphs showcasing progress over the course of a day or week.
Compare to previous periods and learn from the past to make better decisions in the future.

Explore more ItemPath solutions

Creating a widget
Learn how to customize your Dashboard with all the widgets you need. Add colorful graphs and charts using snapshots.

What is a snapshot?
A snapshot uses report results to group and present data as useful and visual information. These are used to build widgets for dashboards.

Customizable reports
Use templates to build specific to your data needs. The Reporting feature captures data progression so you can see your results over time.