


Use Case: Reports
Gain Control Over Warehouse Performance
Summary
ItemPath Reports provides an advanced, flexible reporting engine that enables operations and inventory managers to create, customize, and automate detailed reports and visualizations (Snapshots) from their Power Pick transaction data, ensuring critical Key Performance Indicators (KPIs) are tracked effortlessly and continuously improved.
Persona
Warehouse Operations Manager
Challenge
Limited reporting capabilities and data gaps.
Feature and Solution
ItemPath Reports allows users to build highly detailed reports from the ground up, leveraging all available Power Pick transaction, order, and material data. Users can select and modify specific data columns, apply advanced filtering, and use common groupings to organize and summarize complex information.
Example:
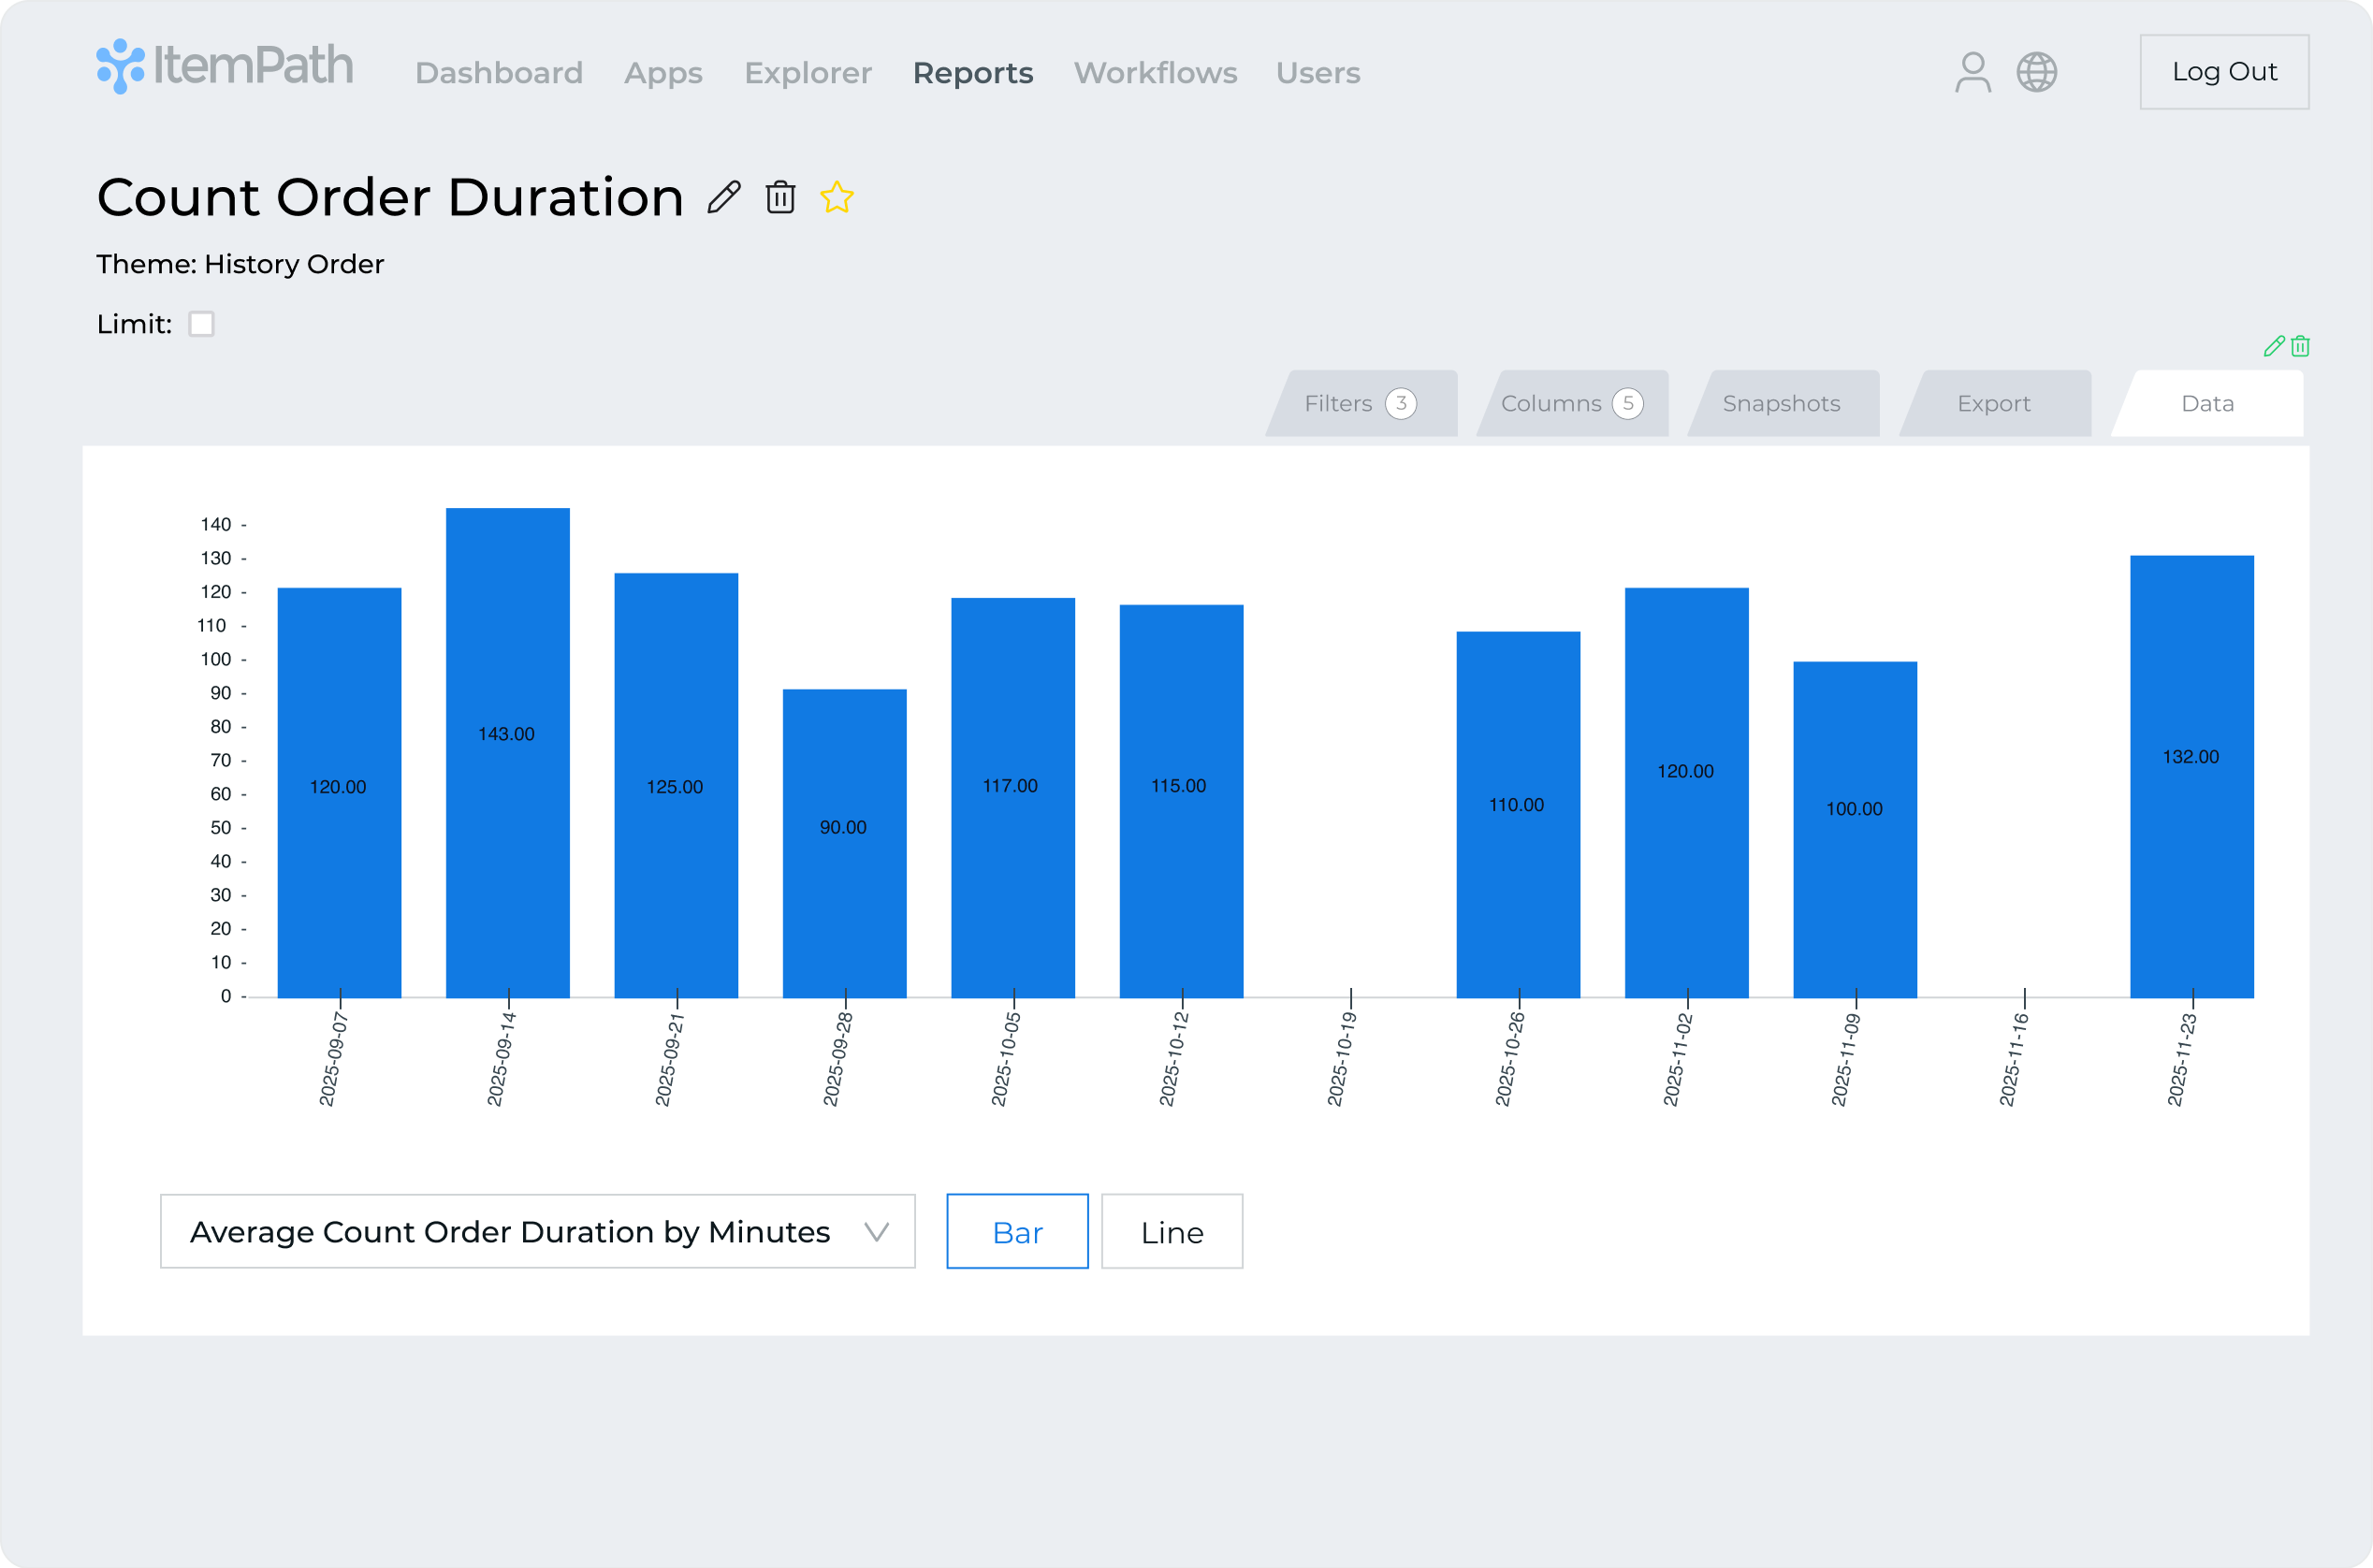
The Warehouse Operations Manager knows the historical average cycle count duration is approximately 120 minutes (2 hours) per order. The manager uses the report to quickly identify and investigate weeks where the average duration was either exceptionally high or low compared to this historical norm.
The Warehouse Operations Manager creates a “Count Order Duration” report, using filters to target Cycle Count orders completed in the last 12 weeks.
A comparison column is used to calculate the "Total Count Duration (in Minutes)" between the order's start and completion time.
A Snapshot is created to visualize the week-over-week average count duration.
The chart immediately highlights that most weeks fall within the 120-minute average, but one week spiked far over, and another dipped far below. Weeks with no activity are also visible. The manager can now drill into the raw data for those specific weeks
Key Results and Benefits
By transforming raw data into powerful, customized reports and visualizations, ItemPath Reports empowers operational leaders to move beyond guesswork. It provides real-time visibility and historical trends to continuously drive efficiency and validate process improvements. Unlock the full potential of your Power Pick data to make informed, strategic decisions every day.
Top Capabilities
- Custom Metric Calculation: Comparison columns allow users to derive crucial KPI’s, such as Average Count Order Duration, turning raw time-stamped data into actionable intelligence.
- Targeted Data Filtering: Quickly isolate specific history records, ensuring reports provide precise, focused metrics for analysis.
- Performance Trend Visualization: Leverage the Snapshot feature to create dynamic charts and trend lines, providing month-over-month monitoring of performance targets and continuous improvement.
Operational Benefits
- Identify Performance Gaps: Pinpoint underperforming operators, shifts, or storage units quickly.
- Validate Strategic Improvements: Use Snapshots to provide visual, objective proof (e.g. a 15% reduction in average order duration) that new operator training or process changes are directly yielding positive results.
- Drive Inventory Accuracy: Proactively track and minimize inventory variance and shrinkage by analyzing detailed transaction history.
- Informed Decision Making: Move from reactive problem-solving to strategic, data-driven planning.
Additional Resources
To learn more about how to get the most out of your data with ItemPath Reports, here are some helpful resources:
Master the Reporting Engine
Learn how to build highly detailed reports from the ground up. This guide covers how to select data columns, apply advanced filtering, and use grouping to summarize complex information.
Visualize Your Success
Master the core functions of ItemPath Reports with this step-by-step course. You’ll learn how to create dynamic Snapshots and visualizations to track performance trends and validate operational improvements.
