


Adding Target Lines
Watch this video or follow the steps below to learn how to set target lines on your bar chart widgets.
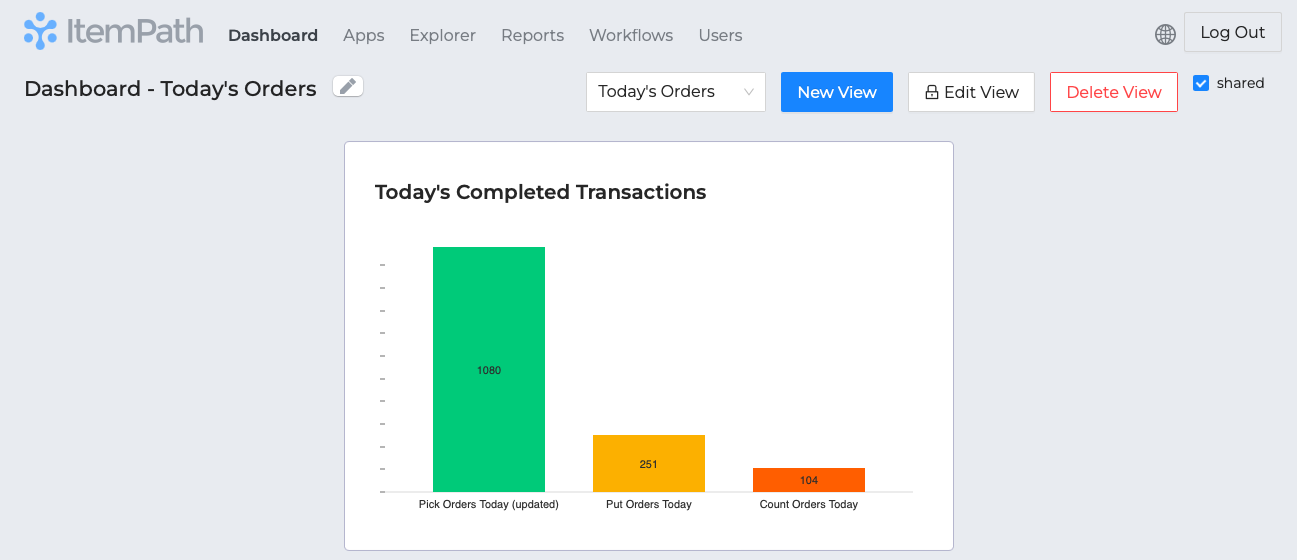
In a Dashboard widget using a bar chart, you can add target/trend lines to the chart to keep an eye on KPI goals. Let's go through this example using a widget that's been set up to show the day's transactions in a bar chart.
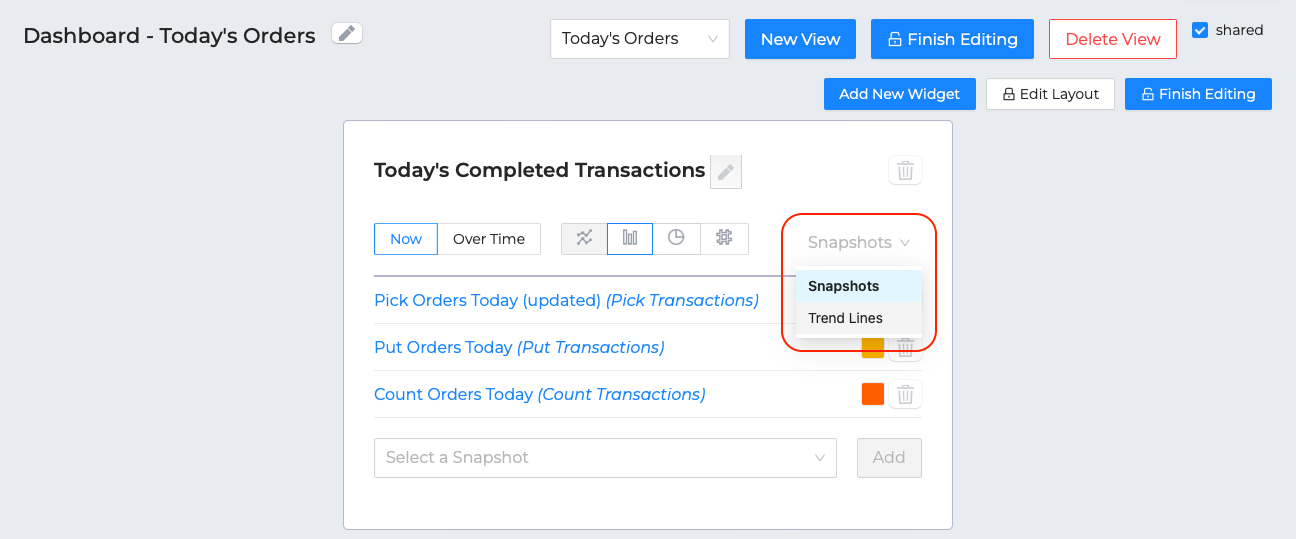
First, open "Edit View" and click on the "Edit Widget" mode. In the widget, toggle from "Snapshots" to "Trend Lines."
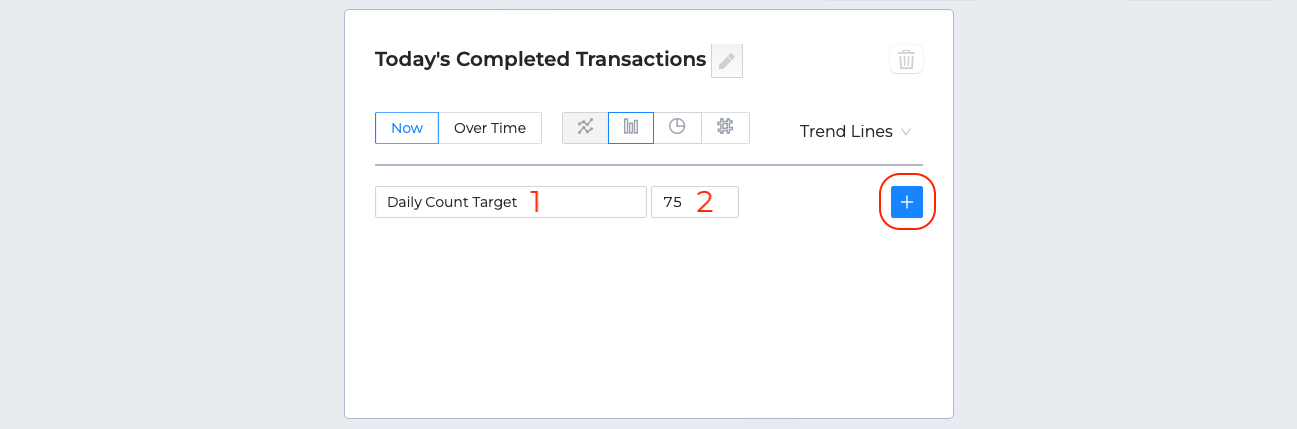
Here, you can name your target line (1) and set the number (2). Make sure to click the blue "+" button to add the line when you're ready.
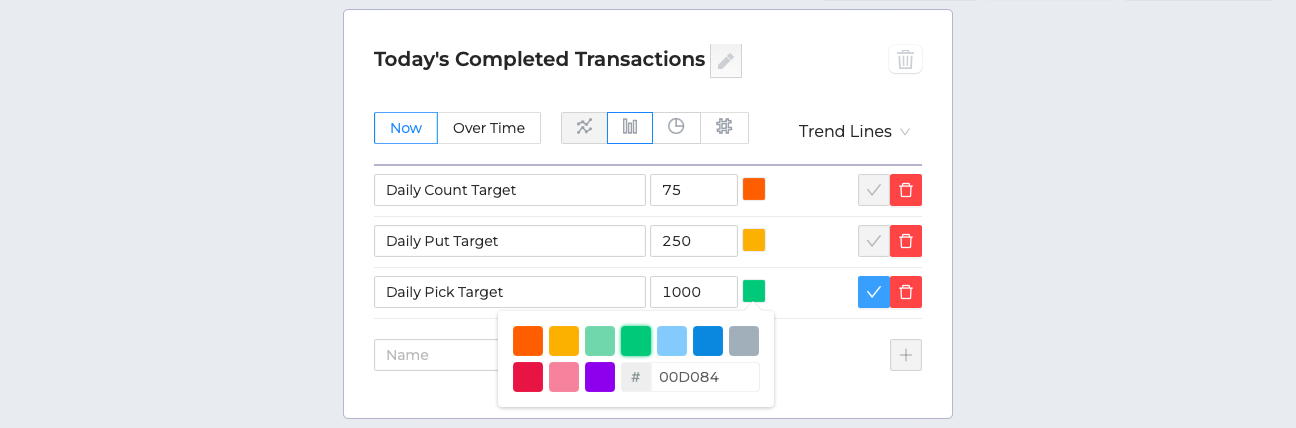
Once you've added a trend line, you can change its colour from the default blue. In this case, the colours are set to match their corresponding bars (green for picks, yellow for puts, and orange for counts).
When you're finished, toggle "Finish Editing" to see your widget with new target lines! You can always go back to edit mode if you need to modify anything.
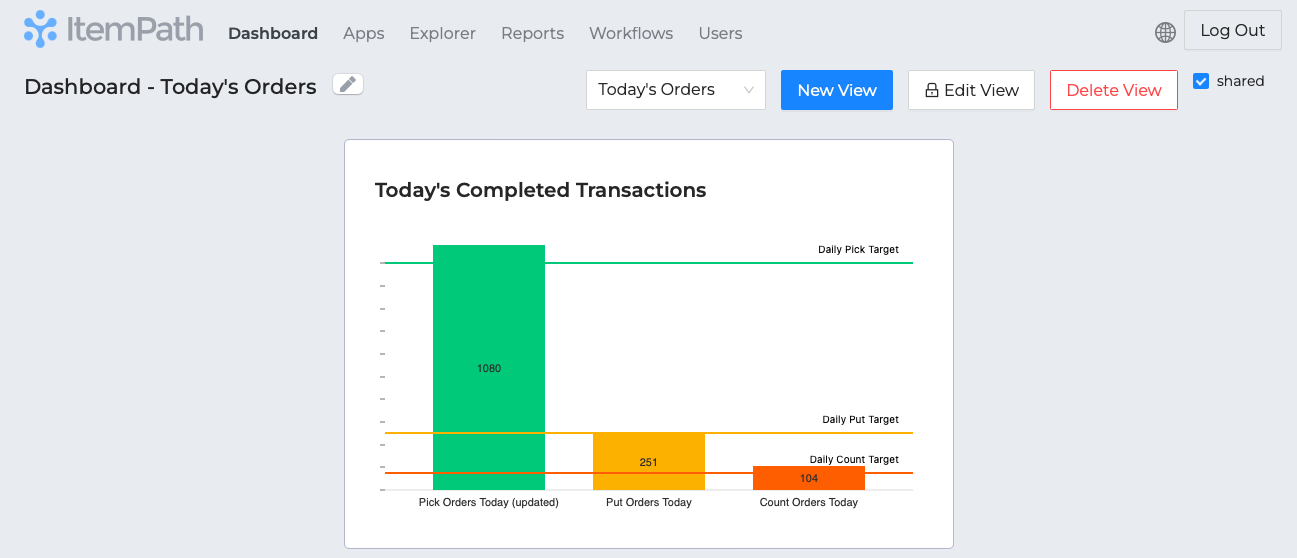
Note: If the number exceeds the range of the chart's values, it may not show. In the example, if a target line was set to 1500, the highest bar in the chart is only at 1080, so the target line will be literally "off the charts."