Creating Views & Widgets
Watch this video tutorial or follow the steps below to set up your first widget.
Widgets are fully customizable with sizes and colours and chart types. The only limitation on widgets is that the snapshots in them need to come from reports with the same theme, in order to properly compare the data.
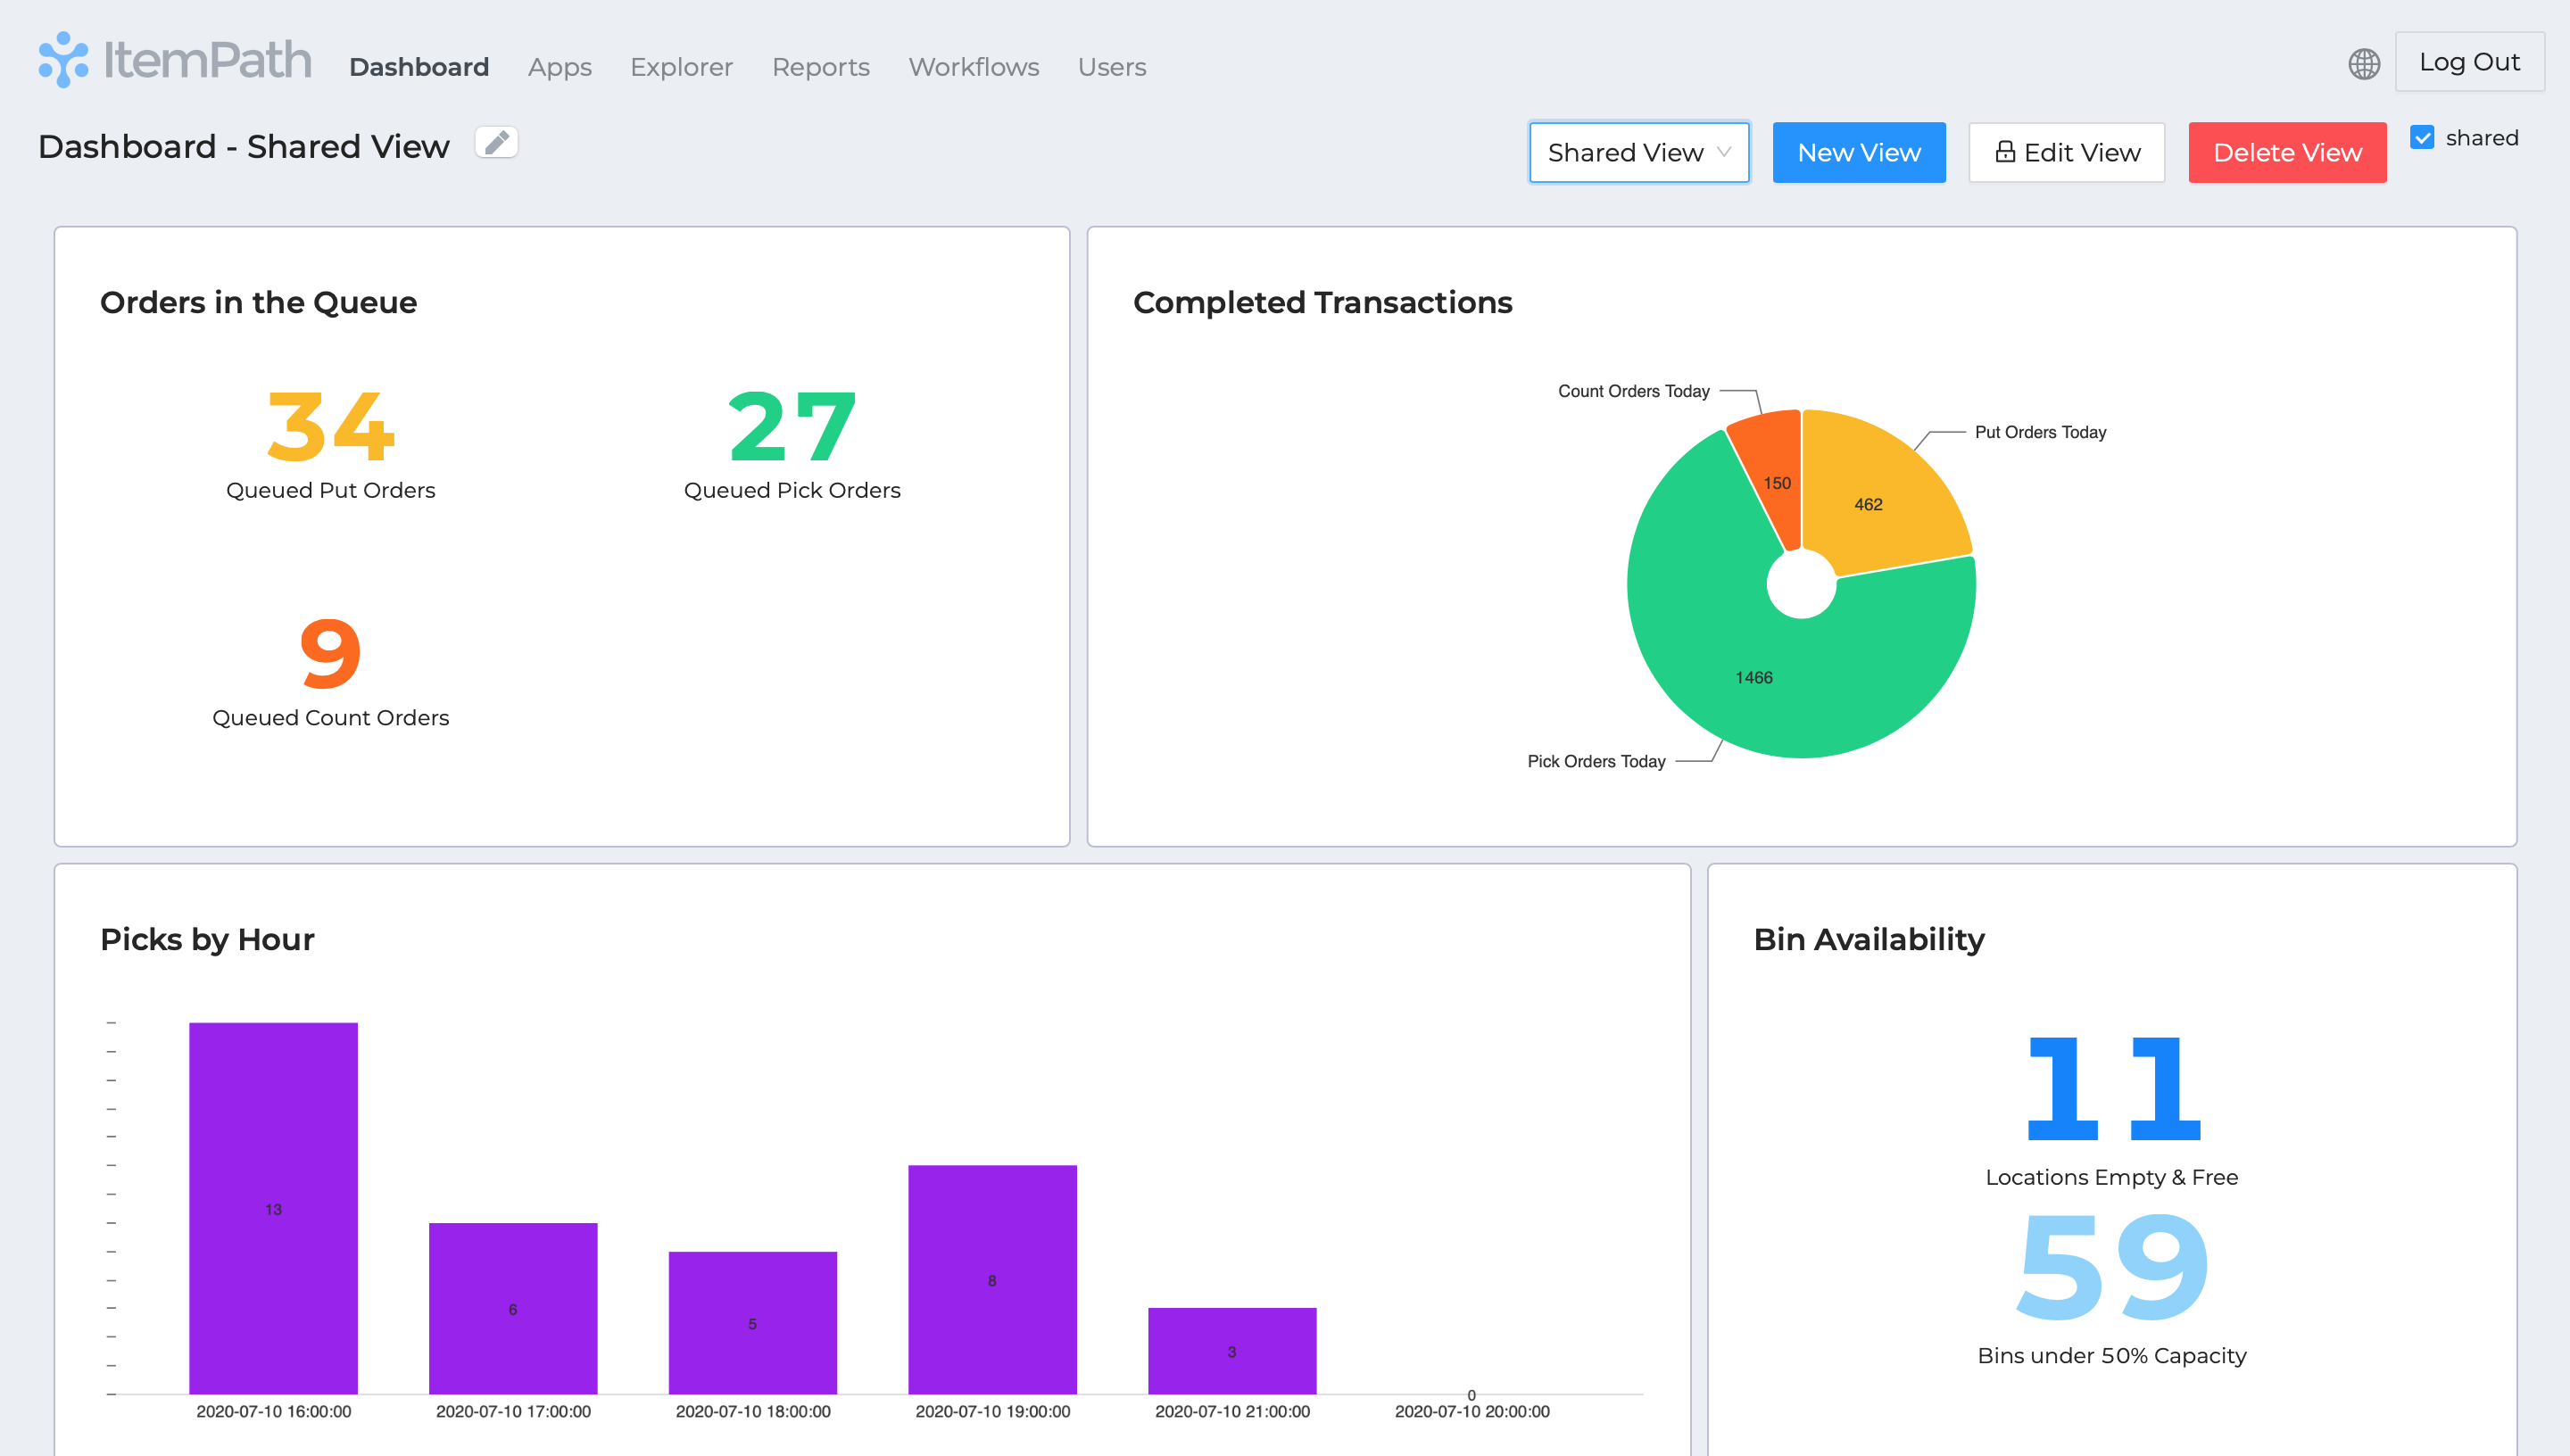
Before adding a widget, make sure you've selected the view you want to add the widget to.

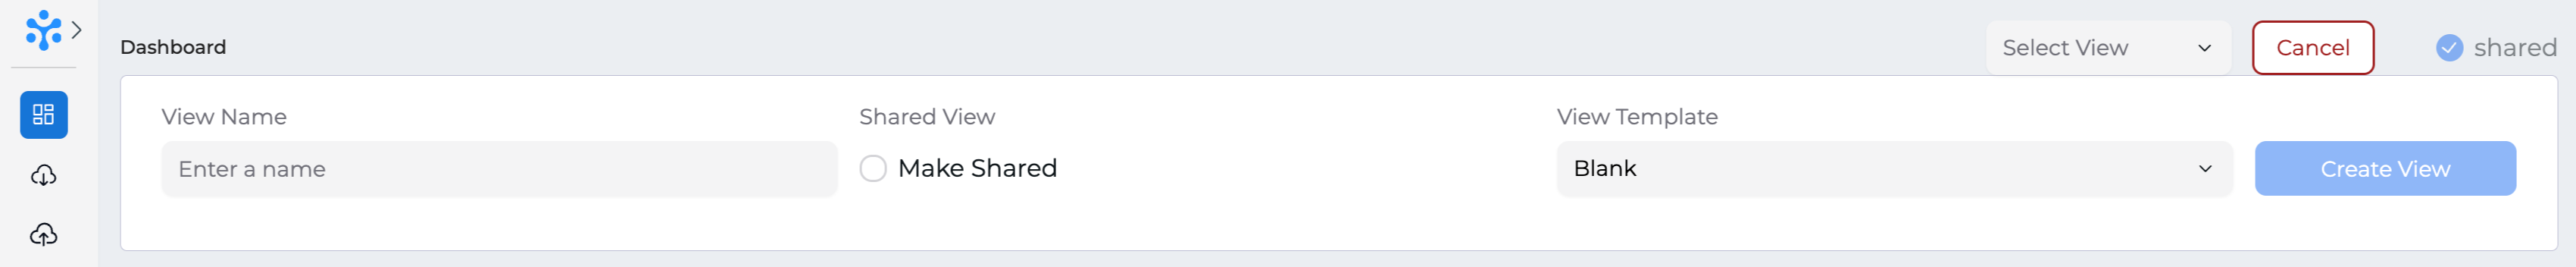
Click to add a new view and give it a name. By default, the view will be private, but you can make it public by checking the Make Shared checkbox. You can choose a template of another view that has already been created, which will create a copy of that view. Click Create View when ready.
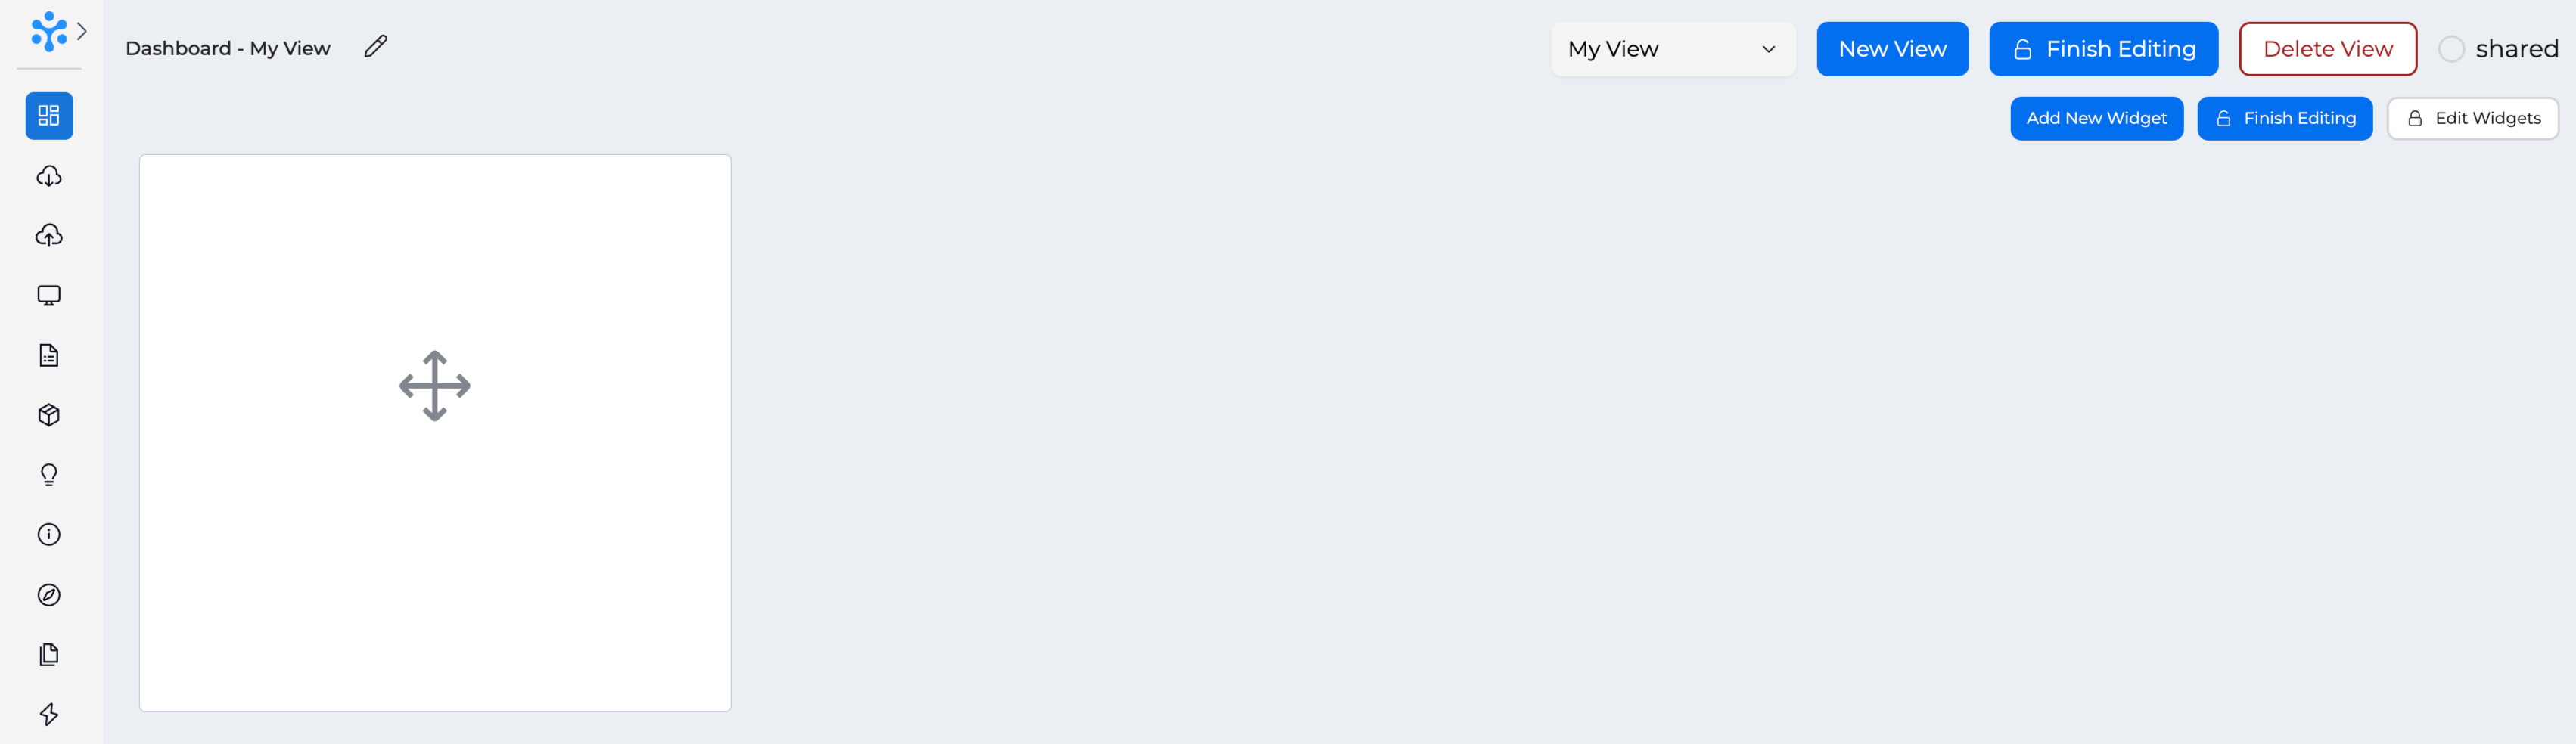
To add a widget to the dashboard view, start by selecting Edit View. Then select Add New Widget in the top-right corner of the screen.

Click Edit Layout to enable moving the widget by dragging it and resizing using the handle in the button-right corner. Click Finish Editing when you're done.
Next, give your widget a name. To do this, select Edit Widgets, then select the pencil icon beside your new widgets name. If you want, you can use the same name you used for the report. Press enter or select the check mark to save the name.

Now add the snapshot you want to display to the widget. You can add more than one snapshot, but we'll start with the snapshot you set up in the Reports class. You can scroll to it or begin typing to narrow the search.

Once you've selected the snapshot, click Add.
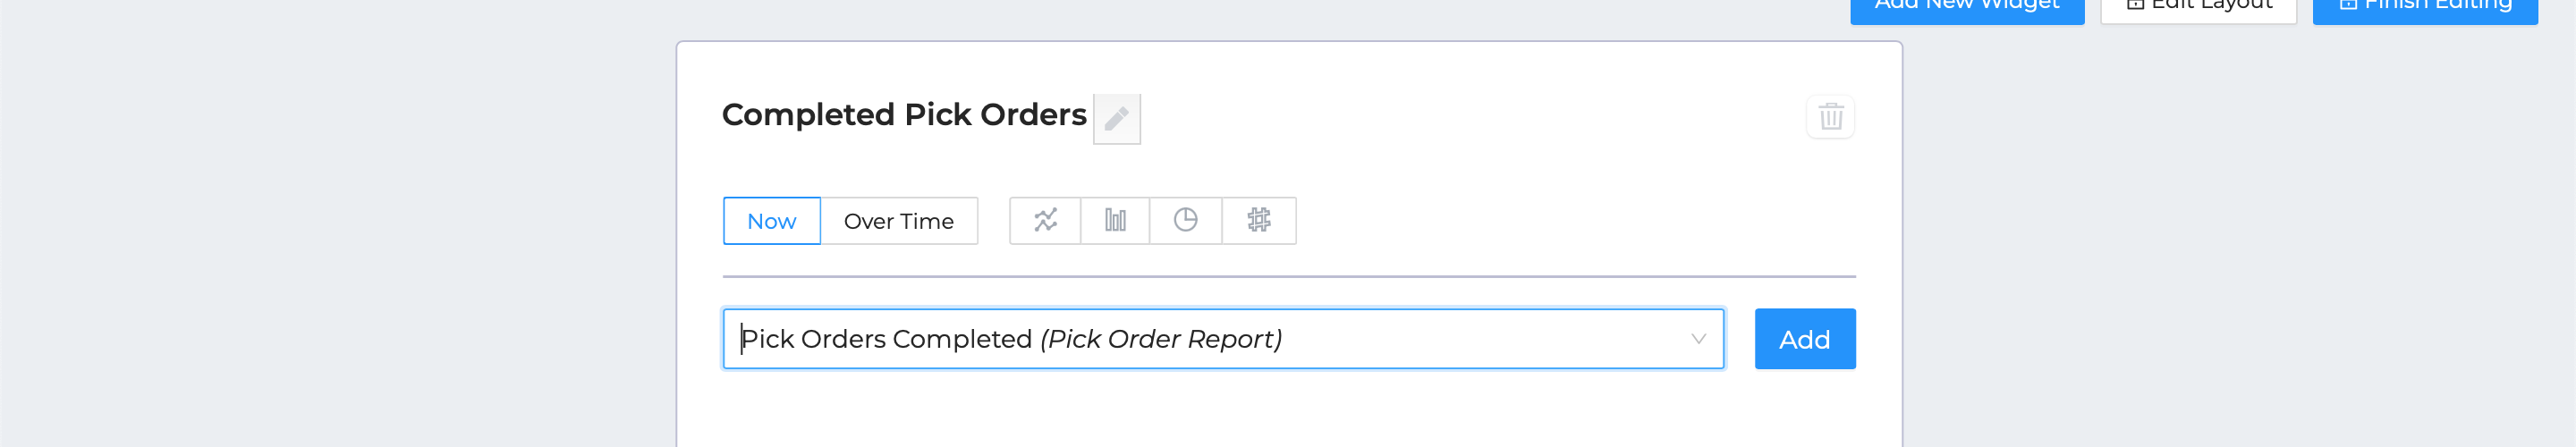
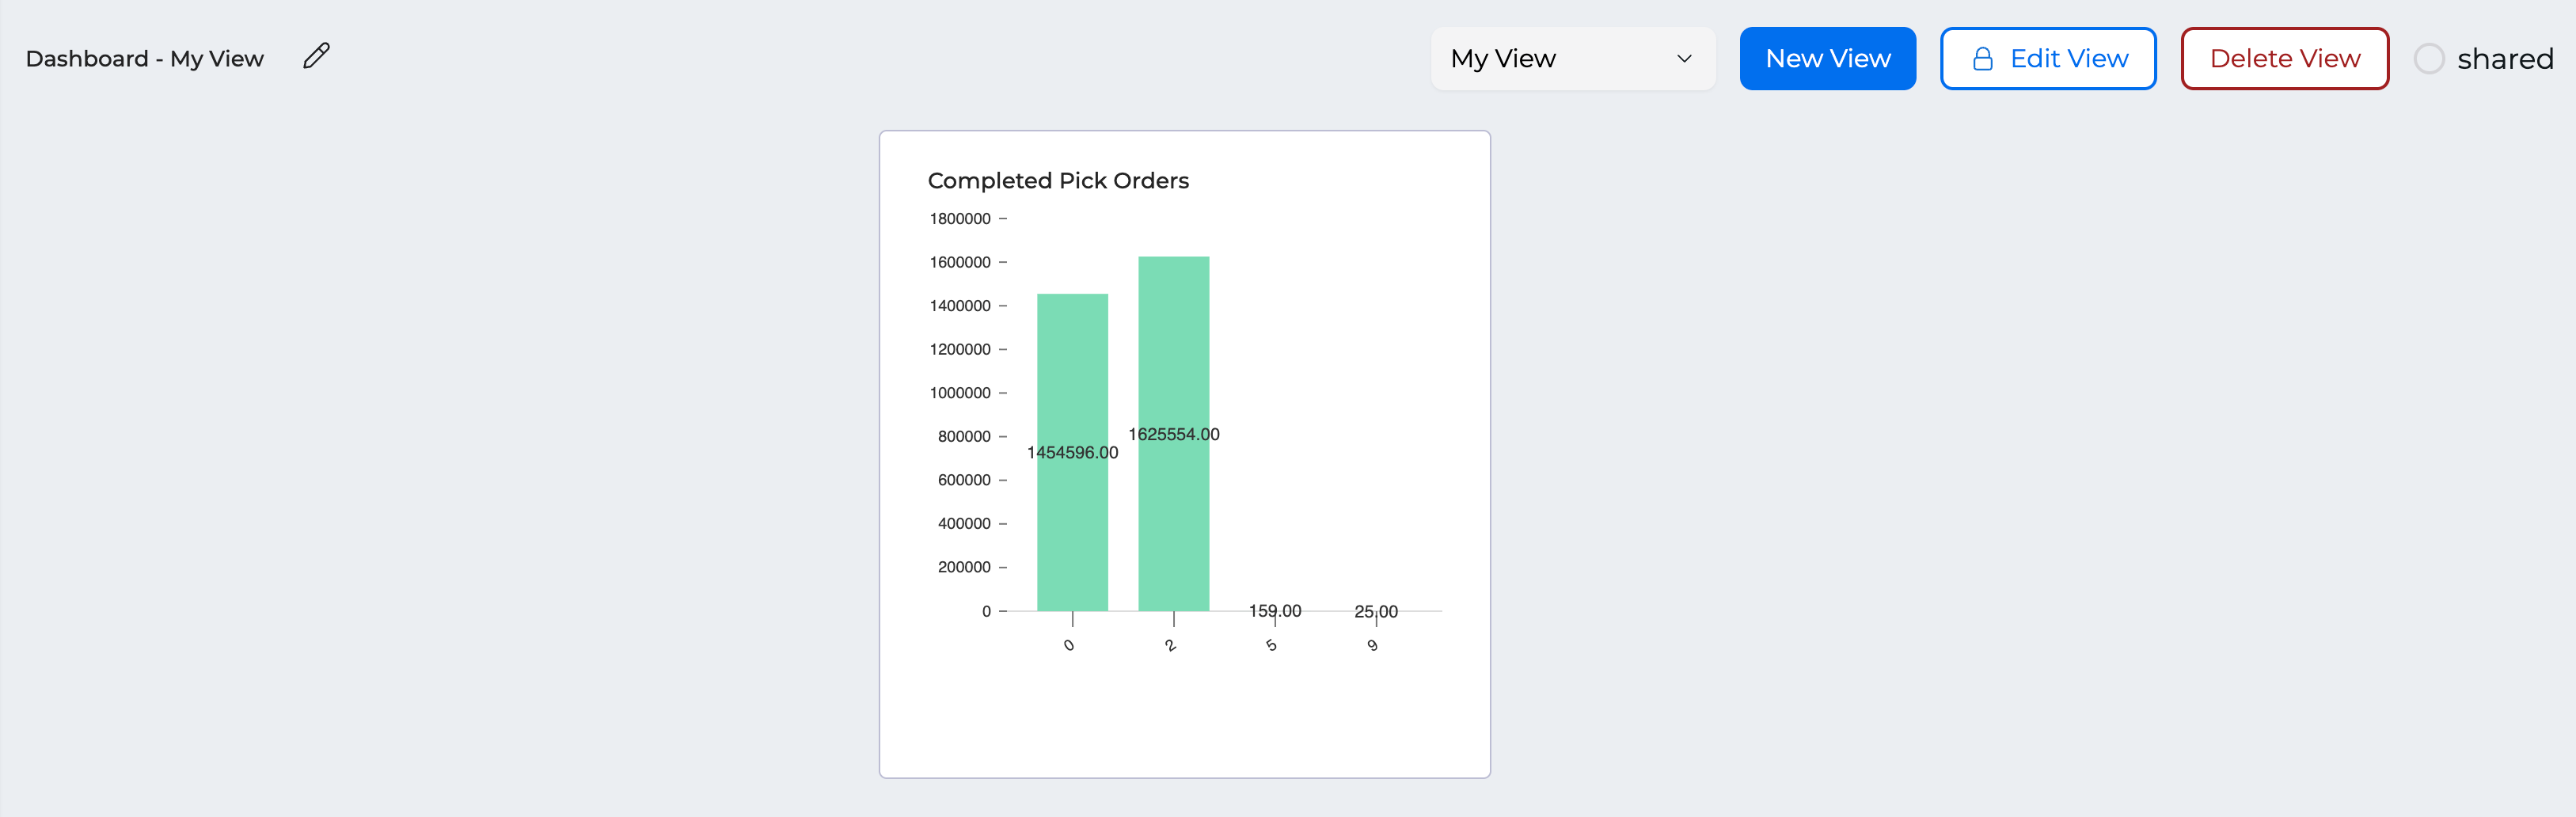
Because the snapshot is presented as a graph, choose a graph format to view the data.

You can also set a custom colour per snapshot. Trying picking a new colour for your graph.

Click Finish Editing the widget and view when you're done to view the final result!