


Creating a Snapshot
Snapshots are able to gather report data by specified time slices, consolidate data by groupings, and present the data visually in a graph or totals.
To add a Snapshot to your report, click the Snapshots tab.
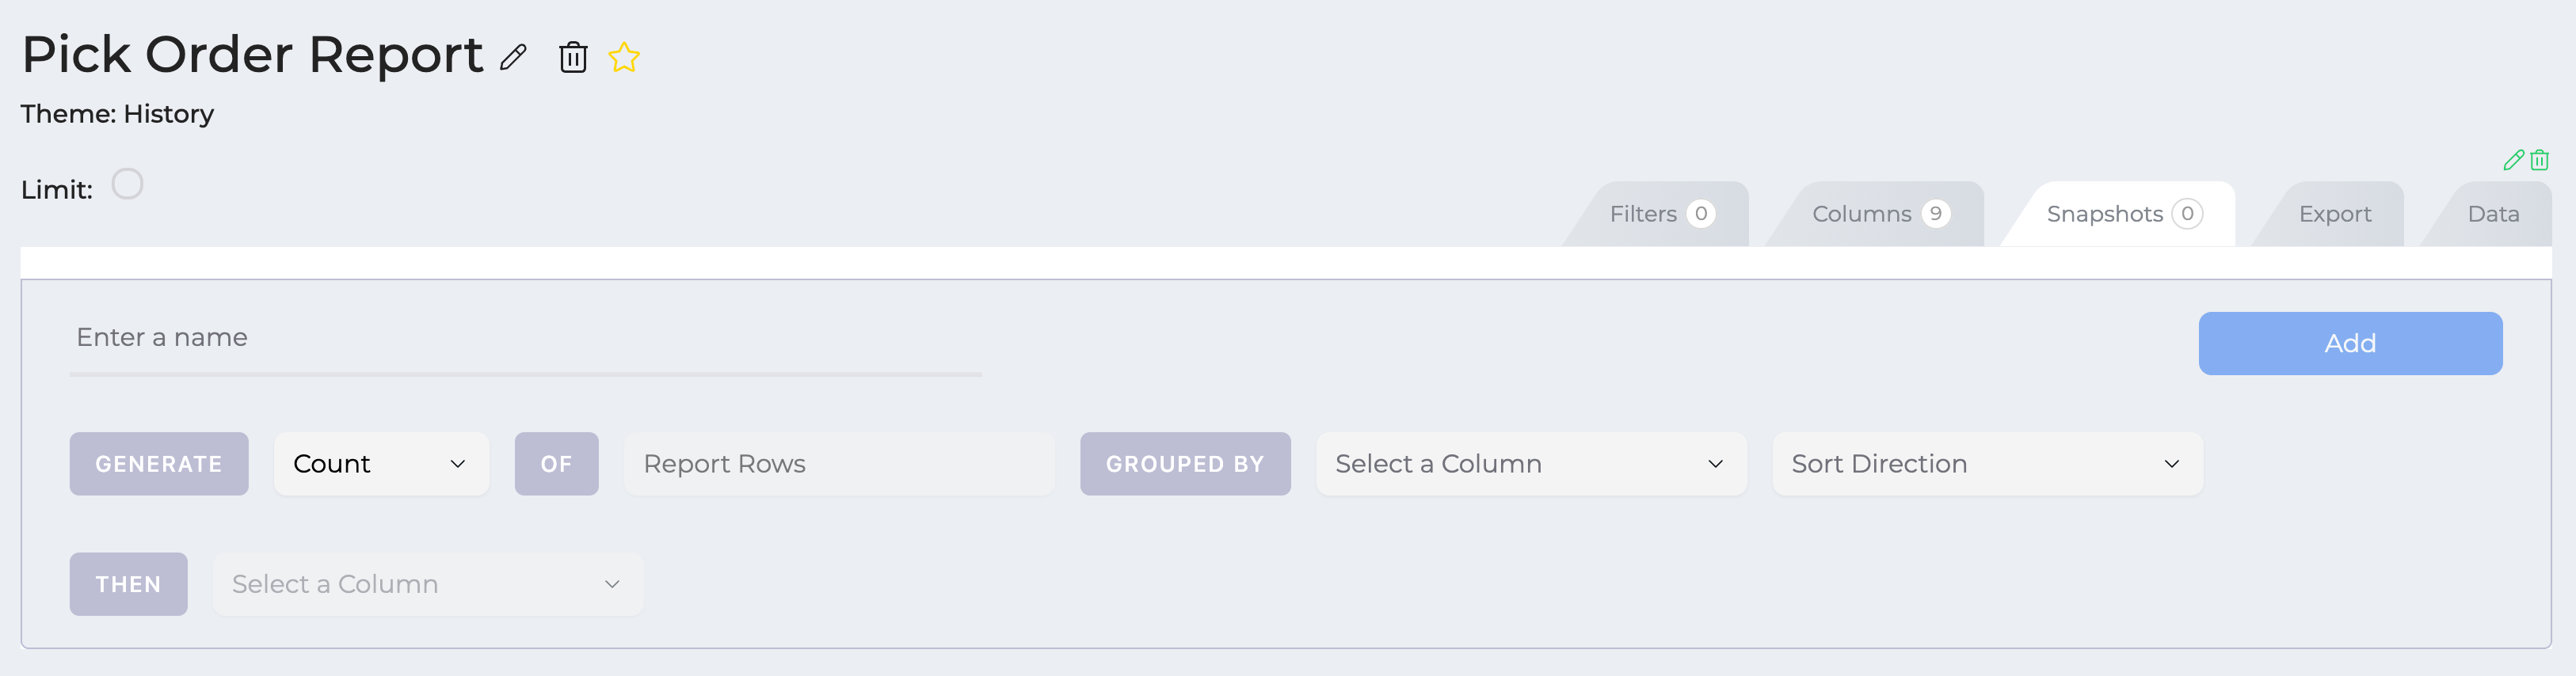
For this snapshot, we'll measure the number of completed Pick Orders over time, so the name of the snapshot should be reflect that, with something like "Pick Orders Completed."
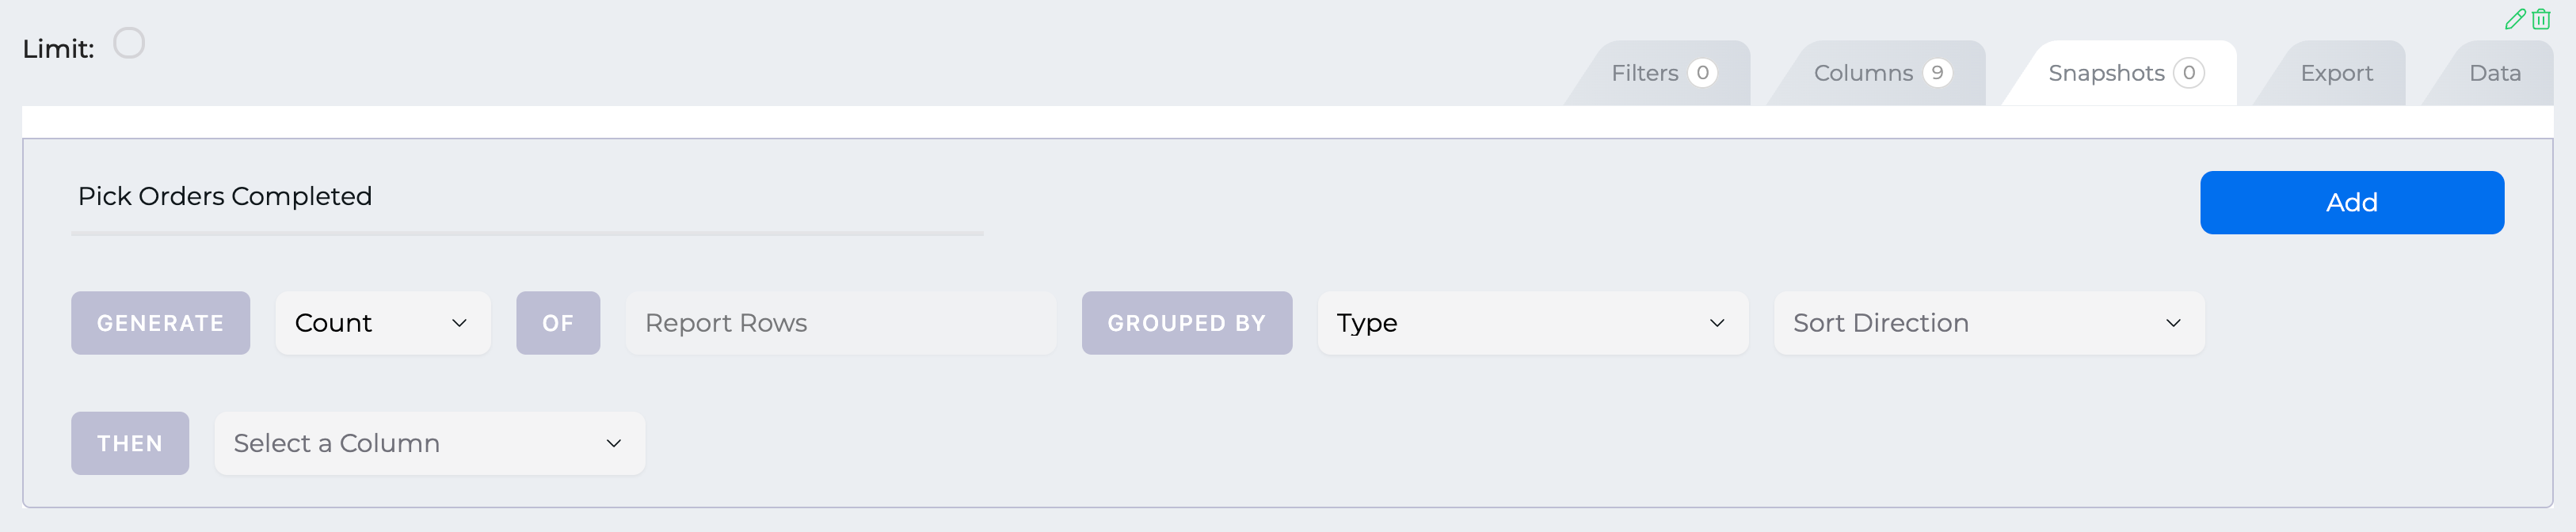
You can use a few different calculations to measure data. The default is "Count," which will count the number of completed Pick Orders by tallying the report rows. Other selections will calculate either the sum, average, minimum, or maximum of a column that has numerical values.
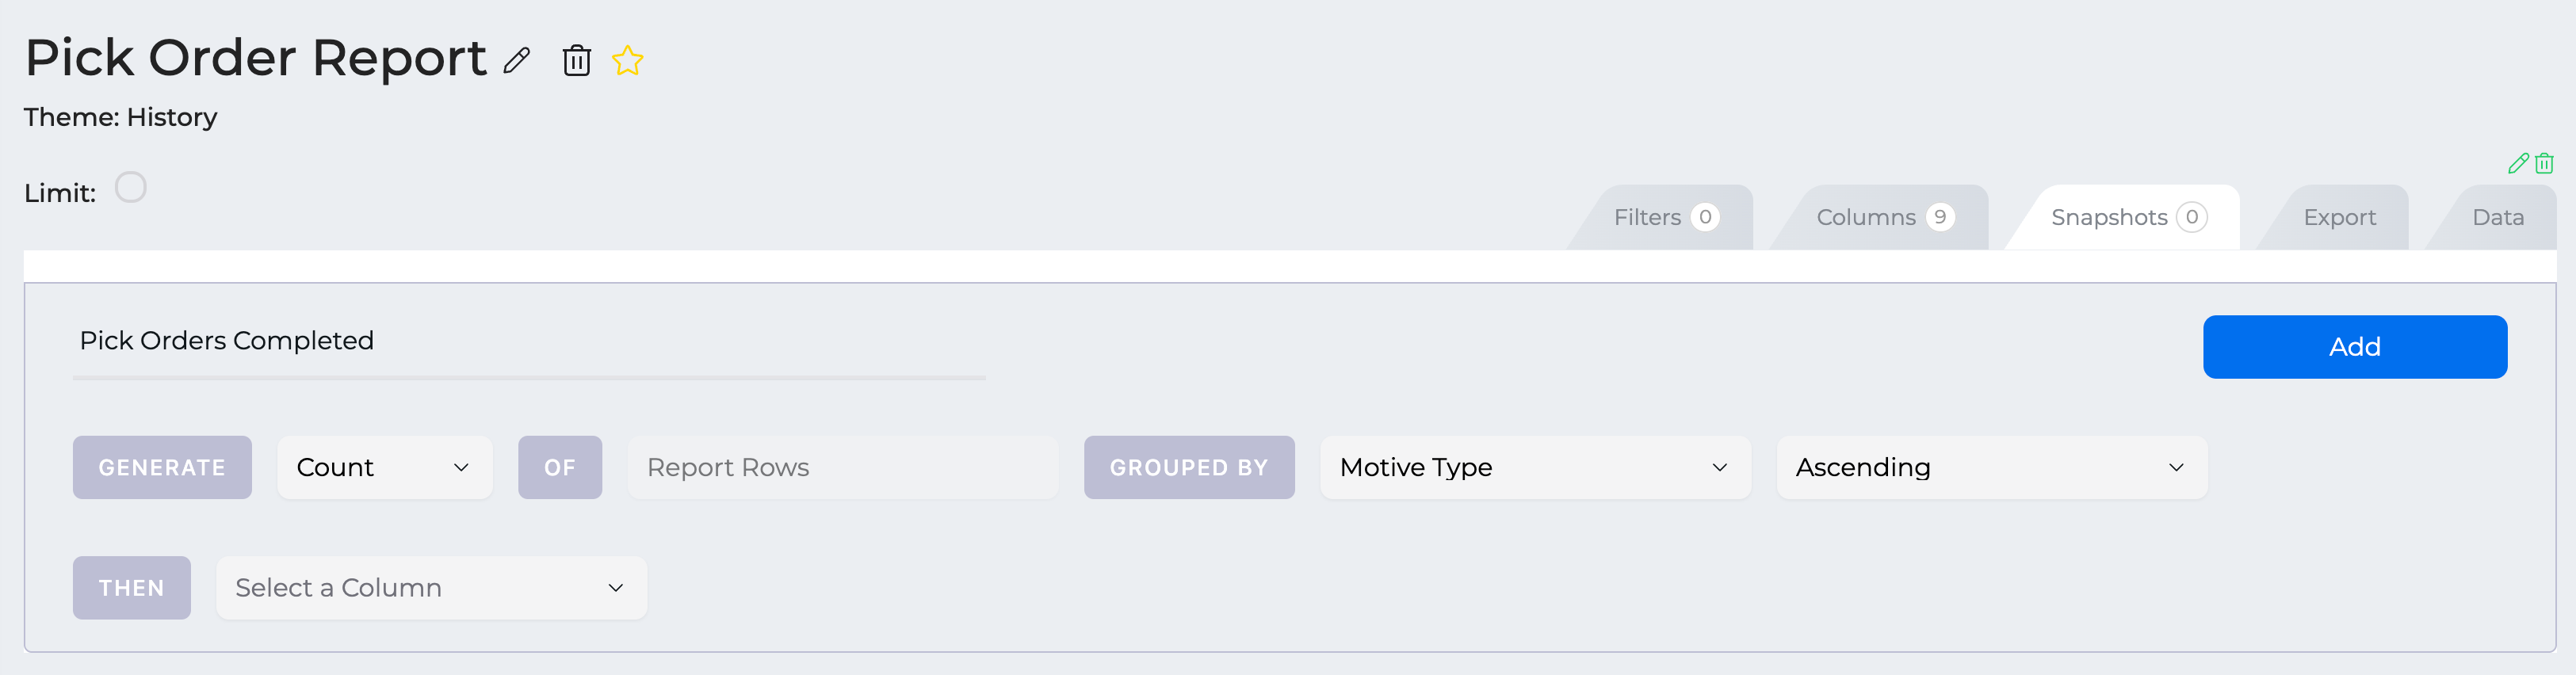
We also have the option to group the data by a column. This is useful for consolidating data by a certain field, like a certain type of Pick Order. In this case, we'll group by the "Motive Type" column to see the various motives assigned to the orders.
You can optionally choose to have multi-level grouping for even deeper analysis. In this example, we'll just group by "Motive Type".
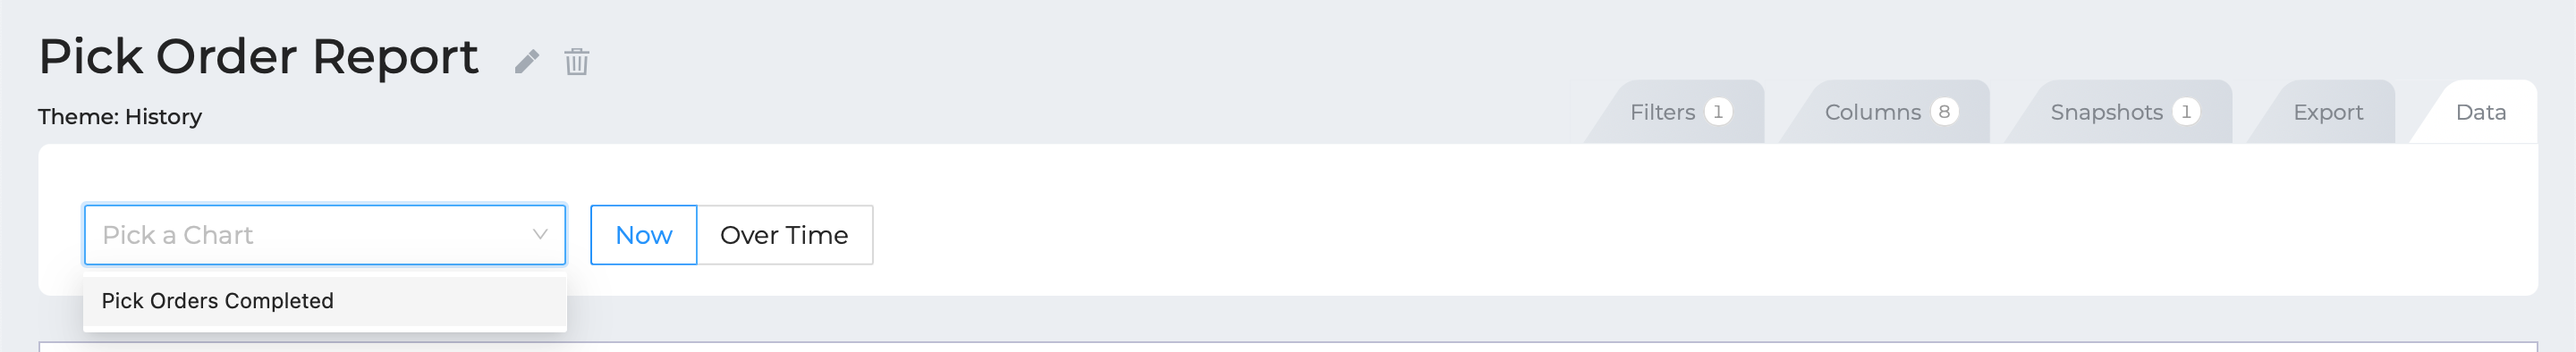
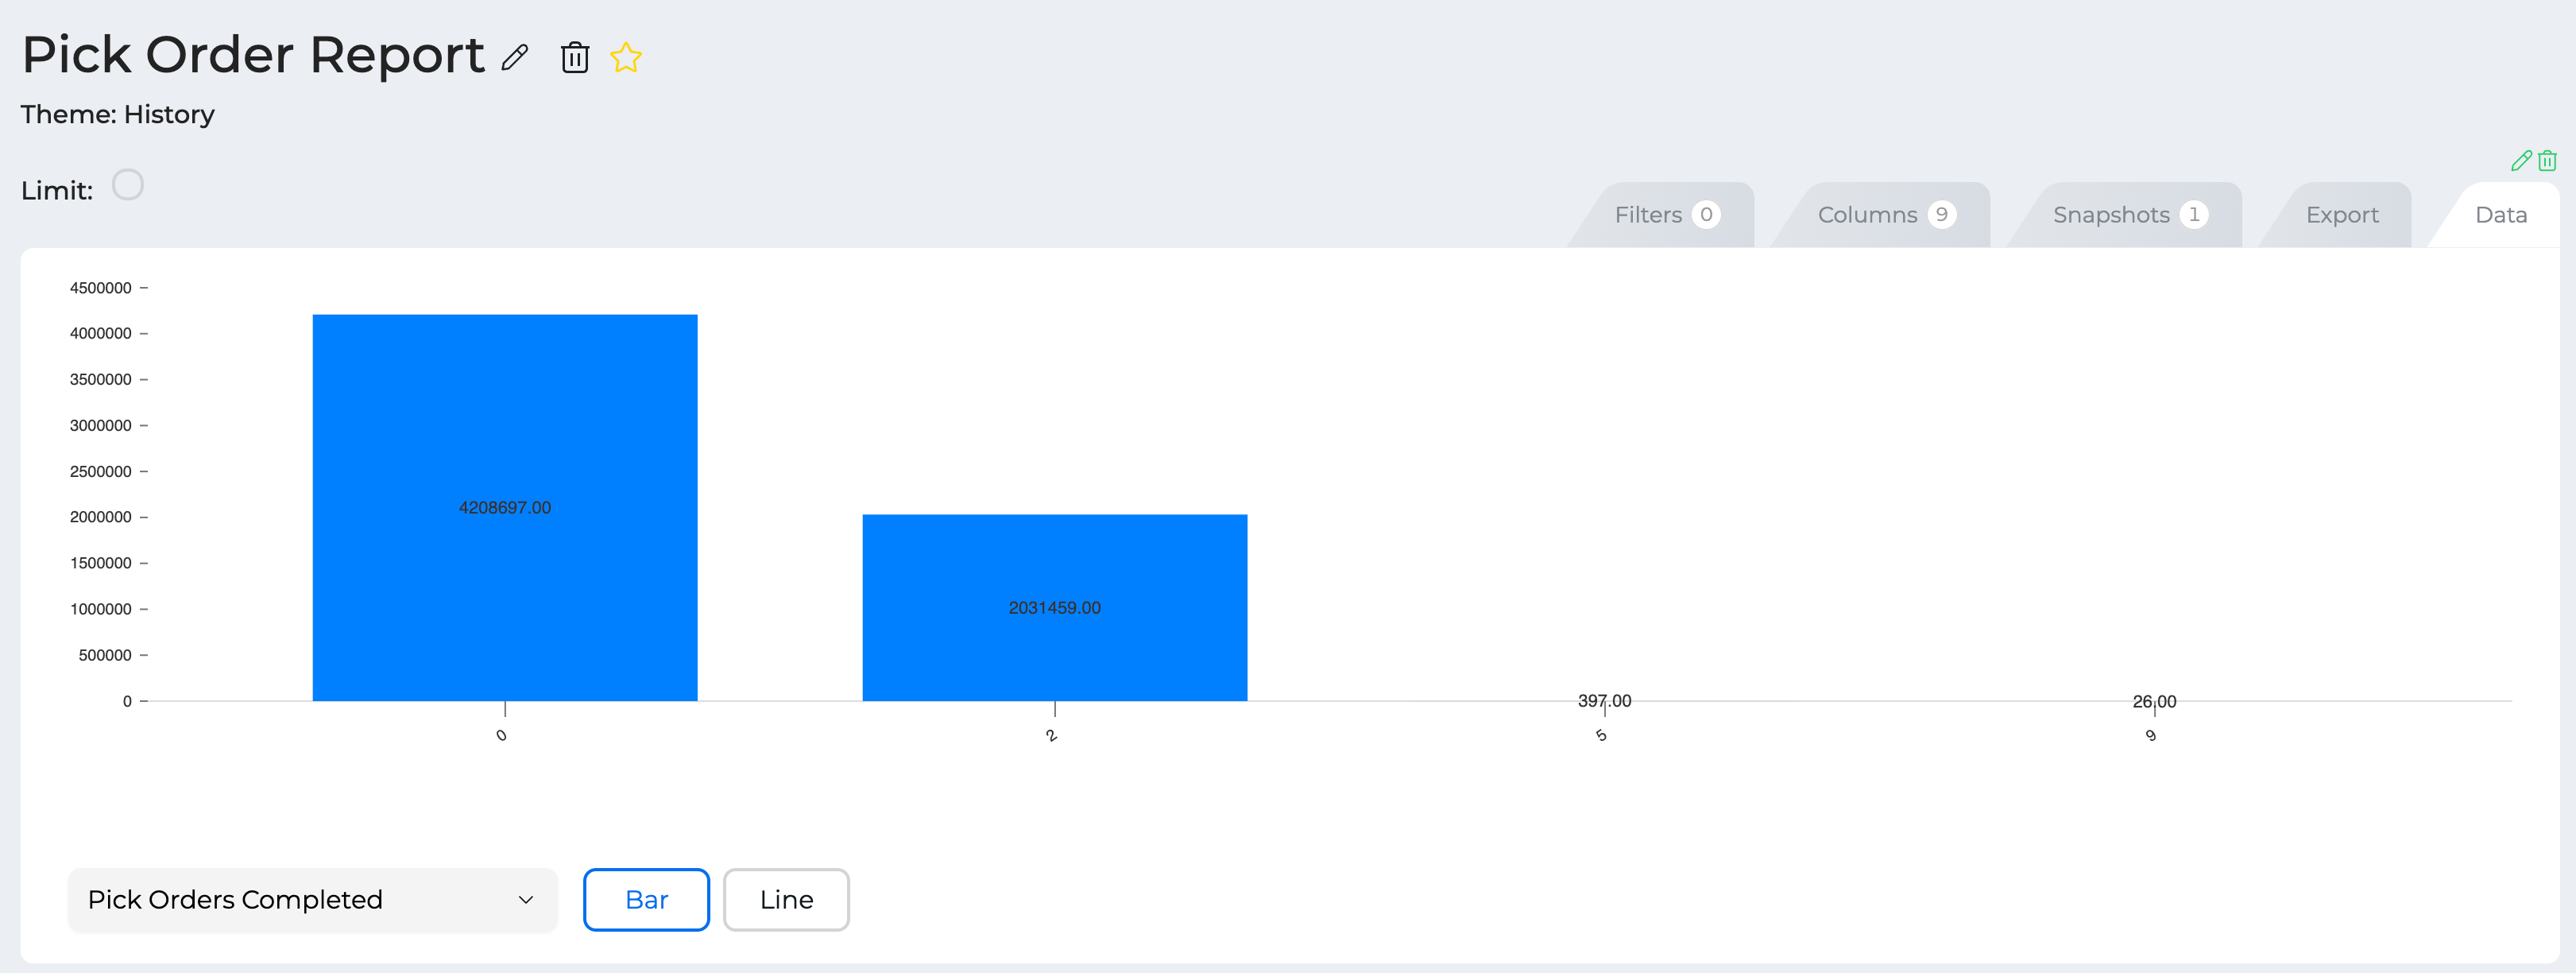
Back in the Data tab, you can now view the Snapshot you've added by selecting it from the "Pick a Chart" dropdown.
Depending on the data in your system, you'll see different results in your graph, but it can be useful to see a quick glance of these totals. You can read more about the meanings of the different Motive Type values in our History report theme reference (the History table contains transactions). It's expected that you'll see some type 5 (Deleted) and type 6 (Cancelled). Most, however, will be type 0 (No Motive), which indicates that the order was completed as normal.
Remember this section! You'll learn about adding these Snapshots to your dashboard in the Dashboard section of the course.