


Add and Modify Report Columns
In ItemPath, a report is a table of data. When you open a report you may see a chart, but those visualizations are representations of data from the table. When you create a report, you select a report theme. The theme is the source of data in your report, including a base table for your report, along with any linked tables.
Linked tables are a key feature of relational databases. Here’s an example from Power Pick: Transactions are records of individual interactions with the Power Pick system. If your team is fulfilling a pick order, they will generate a transaction record that includes the quantity of items picked, and a reference ID to the order. If you’re building a report on transactions (the History theme), you can include columns from the related table (History Order). For information about columns included in report themes, consult with the Report Data Reference guides.
After specifying a theme, your next step to build a report is to select which columns should be in the final table. ItemPath’s reports have three column types:
| Type | Description |
|---|---|
| Column | Individual columns from tables in your report theme. |
| Comparison | Comparison columns allow you to perform comparisons and operations between two columns in your report, such as calculating a ratio or difference. |
| Count | If you would like to group rows by a column value, you can add a Count column to indicate the number of rows within the grouping. |
Add a column
After choosing your report’s theme (the collection of tables ), you’ll want to select the specific pieces of information (columns) you want to see in your report table.
Here’s how you can add a typical column:
- Select the Columns tab of your report. If this is a new report, this tab might be empty.
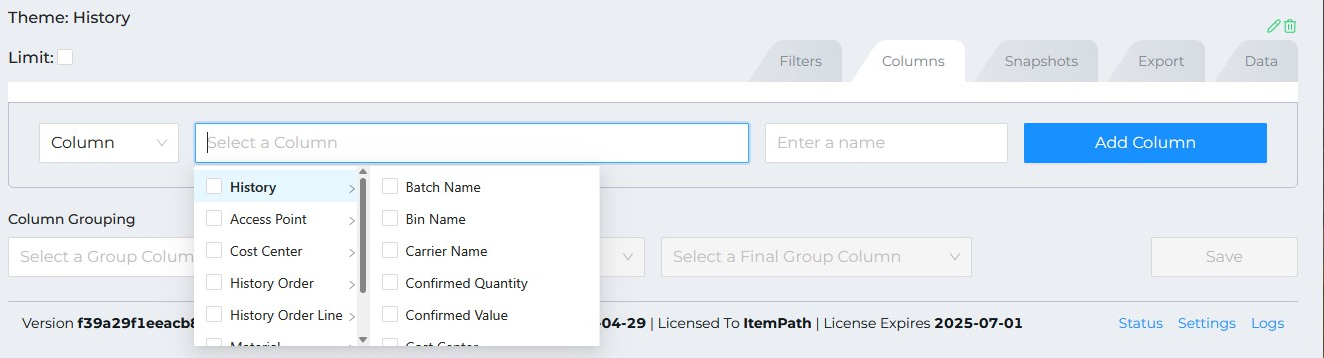
- Look at the bottom of the Columns tab, you will see a dropdown menu that says “Column”, a textbox that says, “Select a column”, and a button that’s greyed out and says “Add Column”.
- Select the Select a column textbox, a dropdown will appear listing the different tables of data included in your report’s theme.
- Explore your theme’s tables by selecting a table name to see individual columns (fields) within the table (don’t select the checkbox — this will add all columns from this table).
- Find the specific column you want to add to your report and select it. You’ll see a check mark appear next to the column name and the name of the column will now appear in the Select a column textbox. Add Column should now be active.
- (Optional) Rename the column using the textbox that appears beside the selected column.
- Add Column.
Note: If you know the column name, you can also type in the "Select a column" text box to find and select columns for filters.
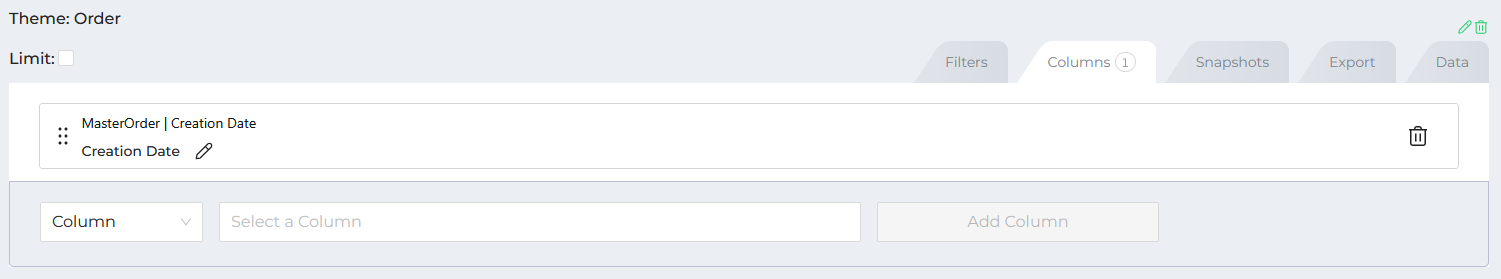
Your column will now appear in the list of columns in the Columns tab.
You can add multiple columns using check boxes in the Select a Column interface. If you check an entire table name (rather than expanding it) you can add every column from the table. You can remove selected columns by pressing the X beside the selected columns in the Select a Column textbox.
Modify a column
After you add a column to a report, it will appear in the list of columns in your Columns tab,as well as in the Data tab. It will also be available for use with filters and Snapshots. You can modify the columns with the pencil icon in the column’s card. This allows you to make several modifications.
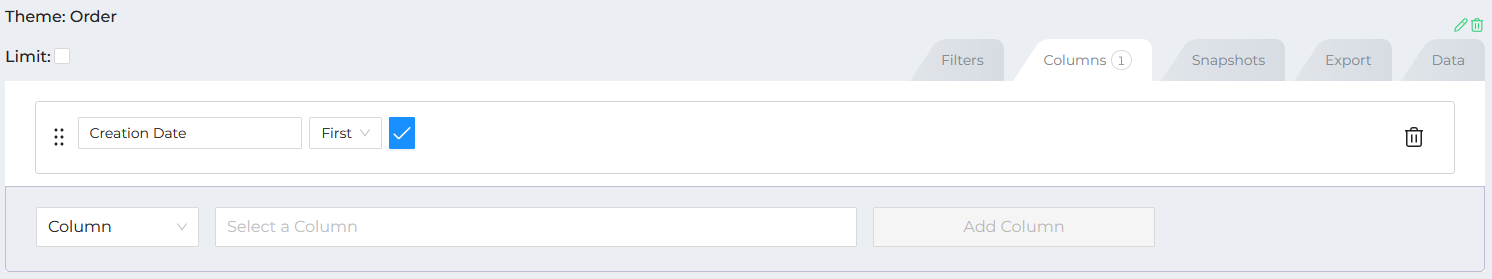
First, you can rename columns after adding them to your report. Basic columns (other than Comparison or Count columns) include their original name and table in the header above their display name. To edit the display name, select the pencil icon, enter your new name, and save with the checkmark.
If you are working with grouping and exploring aggregation functions, you can also specify how the grouping function should treat values from this column (see Groupings and columns).
Second, you can reorder the columns in your report. On the Columns tab, columns appear from top to bottom, but in the Data tab they will appear in the same order, but from left to right. You can reorder columns by selecting and dragging the card using the six dots to the left of the card.
If your report includes a column grouping, you can specify the aggregate function used for this column, using the dropdown beside the column name. Finally, you can remove columns from your report with the trash-bin on each column card.
Comparison columns
A Comparison column is a derived value within your report, which allows you to perform operations on multiple columns in your report. The types of operations that you can perform are determined by the data type of the columns that you are comparing.
Note: Aggregate functions (for example, summing or averaging a group of rows) are separate functions, and covered in Groupings and columns.
To add a Comparison to your report, you must already have the values that you would like to use in the operation added as columns in your report.
Once you’ve done that, add a Comparison column by:
- Select “Comparison” from the Column Type dropdown.
- Select the first column that you’d like to use in the operation. For example, if you use the “Difference” operation, this would be X in X-Y.
- Select the operation from the dropdown, for example “Difference”.
- Select the second column that you would like to use in the operation. For example, if you use the “Difference” operation, this would be Y in X-Y.
- Enter a name for your column (Optional).
- Press Add Column to add your comparison column to the report.
You can perform complex operations using the Comparison column as the basis for other Comparisons in your report. Remember that the only requirement for defining a Comparison column is that you need to have the base columns for the Comparison present in the report. If you are building a complex formula, think about how you can build it from the ground up using multiple comparisons.
Note: You can’t compare a column with itself or perform grouping operations on the same column twice. You can add the same column twice to a report.
Number comparisons
Numerical columns can be integers or floats. Note that IDs and types are often stored as numbers in your Power Pick data, but you typically don’t want to use them in operations.
| Operation | Description | Sample Calculation | Business Example |
|---|---|---|---|
| Percentage | Returns the ratio of the first column to the second column, expressed as a percentage. | (5 / 10) * 100 = 50% | Calculating the percentage of orders fulfilled on time. |
| Ratio | Returns the result of dividing the first column to the second column, expressed as a decimal. | 5 / 10 = 0.5 | Determining the proportion of warehouse space utilized. |
| Sum | Returns the result of adding the two columns | 5 + 10 = 15 | Totaling the number of items in a shipment. |
| Product | Returns the result of multiplying the two columns. | 5 * 10 = 50 | Calculating a density score, such as current quantity times capacity used. |
| Modulus | Returns the remainder when dividing the first column by the second column. | 17 % 5 = 2 | Scheduling cycle counts of inventory items based on a repeating cycle. |
| Difference | Returns the difference resulting from subtracting the second column from the first. | 10 - 5 = 5 | Calculating the change in inventory levels over a period. |
Date comparisons
Date Comparisons only support the calculation of the difference between two time values. Since there is only a single operation, the interface will differ when you select two date columns, with no operation appearing. Instead, a drop down menu appears to specify the unit of time for displaying the difference:

Groupings and columns
If you have added a column grouping you can use the “Count” column type to add the number of rows under your primary column grouping. Column groupings allow you to specify columns that will be used to form groups of rows. For example, if you specify a column grouping by the “Type” column, you can use a Count column to report on the number of rows for each type of order (unique value in the Type column).
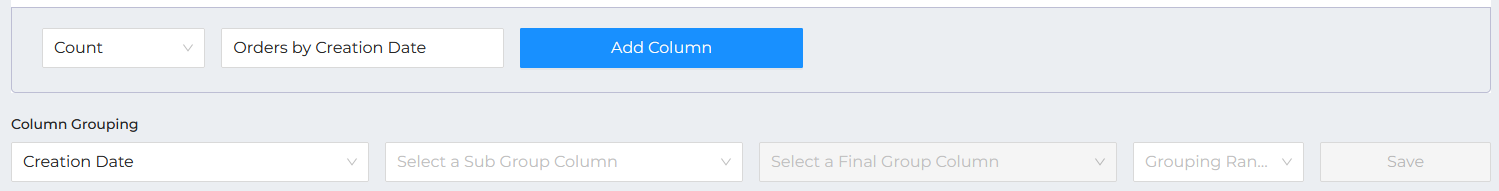
To add a Count column:
- Specify your grouping column.
- Save.
- Select the “Count” column type.
- Enter a name for your count.
- Add Column.
Note: Reports also support grouping and aggregation functions through Snapshots.
When modifying columns, you can specify how ItemPath performs aggregation operations on columns within the grouping. Use the pencil icon in the column card, then select the function using the dropdown beside the column name. By default, ItemPath will use the “First” function (displaying the first value under the grouping).
The available functions are:
| Function | Data Type(s) | Description |
|---|---|---|
| First | Any | This will use the value from the first record/row under the grouping. This can change based on the sort order in your report. |
| Last | Any | The value from the last record/row under the grouping. This can change based on the sort order in your report. |
| Sum | Numeric | The sum of all values under the grouping. Values must be numeric. |
| Mean | Numeric | The mathematical average of the (numeric) values under this grouping. |
| Min | Numeric | The least value in this column under the grouping. |
| Max | Numeric | The greatest value in this column under the grouping. |
| Median | Numeric | The value separating the higher half from the lower half of the rows under this grouping. |