


Filter Report Data
When building a report in ItemPath, you start by selecting a theme and columns to appear in the final table. While you might want to review all data available under a theme, often only parts of the data are important for your report. For example, you might like to build a report on the number of the deviated quantities in the last week.
Note: In Power Pick, a deviated quantity is the difference between the quantity of units requested and units actually processed in a transaction, recorded by the user. This is a specific column from the History table, in the History theme.
To build this report, you would need to select the History theme, add appropriate columns (including Deviated Quantity and the date the transaction occurred), then specify filters to restrict the rows included in your report. A filter is a logical statement that specifies whether a row should appear in your report. If a row meets the criteria specified in your filter, it will be included in your report. When ItemPath generates a report, filters are one of the first operations performed after selecting columns.
Add filters to a report
Before you can add filters to your report, your report must include the columns that you want to filter. For example, if you want to find deviated quantities (with values greater than 0), you will need to add the Deviated Quantity column to your report, then add a filter.
After you have the necessary columns, you can specify basic filters:
- Navigate to the Filters tab.
- Select the column for your filter criterion.
- Select the operator (see Filter operations for details on available operators).
- Specify the value for your criterion.
- Add the filter.
Once you’ve added a filter, it will appear in the Data Filters list. You can adjust the criteria, but not the column used for the filter. After any changes, be sure to Save. To remove a filter, use Remove.
Note: In the filters list, the leftmost textbox with the text “Select a column…” determines the filter group. See Advanced filter logic for how to use this feature.
Example: Weekly Deviated Quantities
For a weekly report on deviated quantities, you will need to add at least two columns from the History theme:
- Creation Date
- Deviated Quantity
Then, based on your plan for the report you know that there are two filters that you want to create:
| Column | Criterion |
|---|---|
| Deviated Quantity | Isn’t 0 |
| Creation Date | In the last week |
After adding the columns to your report, you’re ready to add your filters.
Filter for deviated quantities
To filter for deviated quantities:
- Navigate to the Filters tab.
- Select “Deviated Quantities” using “Select a Column…”.
- Select “Not”.
- Enter “0” in the textbox that reads “Enter a value…”
- Add the filter.
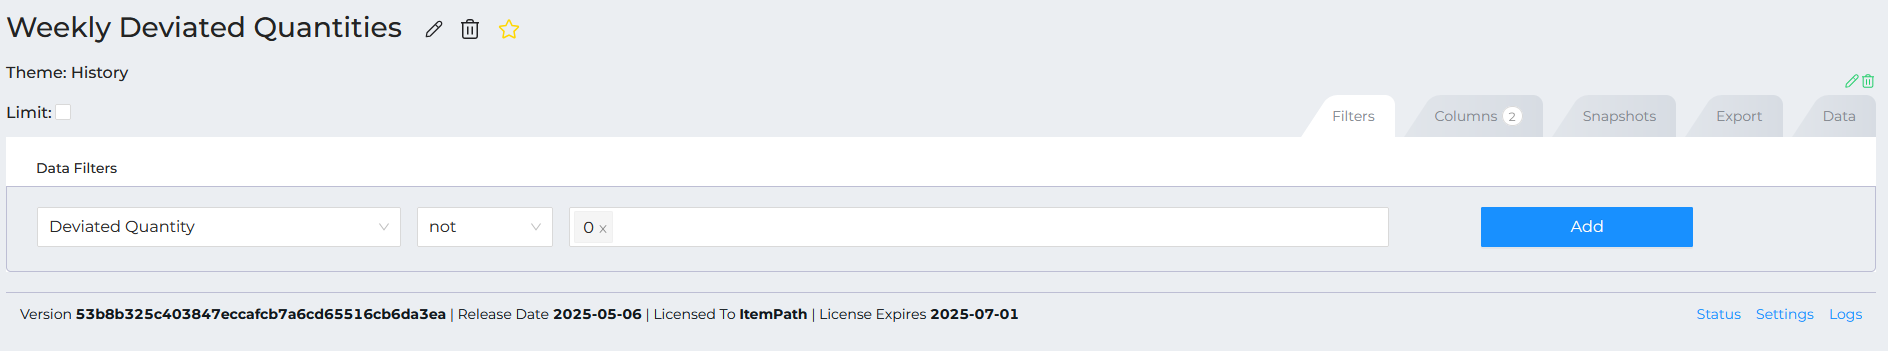
Note: You might expect 0 to be equivalent to “No Value”, which appears in the “Enter a value…” textbox. In Power Pick’s database, “0” is a value — the text “No Value” indicates a record with no data in that column. This can make a significant difference when filtering in reports.
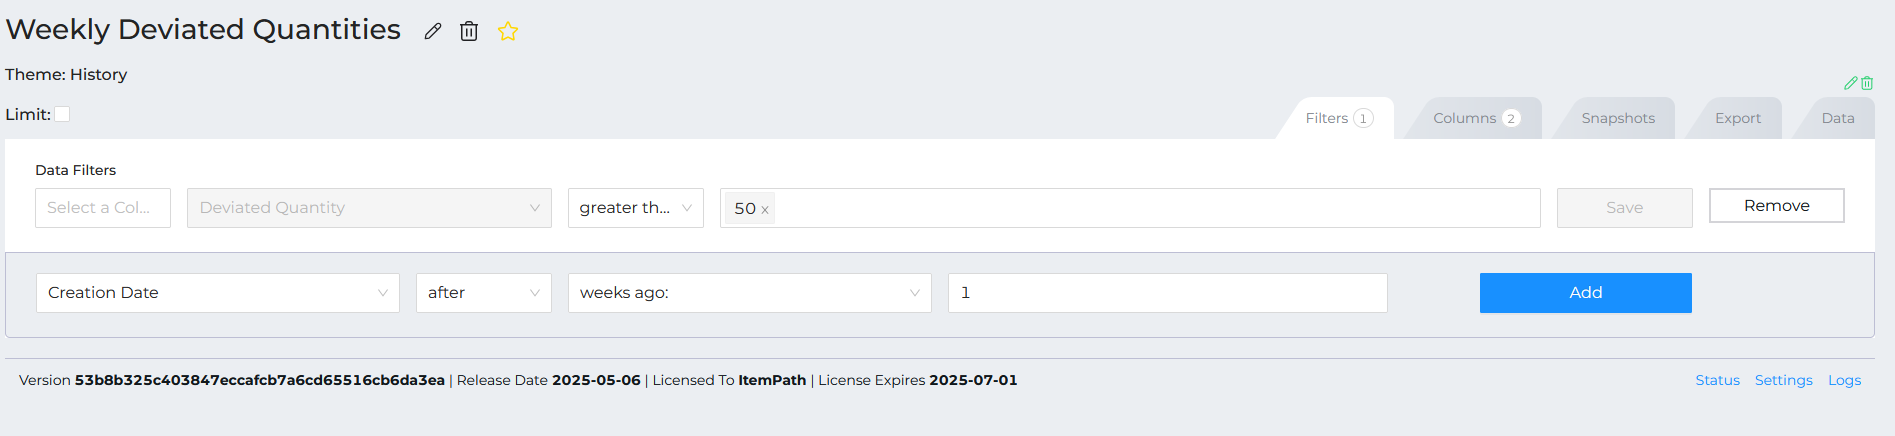
Add a date filter
To filter for transactions from the last week:
- Select “Creation Date” using the “Select a Column…” dropdown.
- Select “After” using the second dropdown box. The UI changes to add a new textbox — filters on date and time values allow for relative and absolute comparisons, you will need to indicate how ItemPath should interpret the values you enter.
- Select “weeks ago:” from the next dropdown box.
- Enter 1 in the textbox that reads “Enter a number”.
- Add the filter.
Note: This example illustrates an additional feature of date and time filters. You can achieve the same result with the “during” operation, see date and time operations for details.
Without additional input, ItemPath will apply filters in sequential order, from top to bottom, using “and” logic. In this case:

ItemPath will apply the filters sequentially, starting with the filter for deviated quantities, then moving to the filter for date. You can control this behaviour using the advanced filter settings.
Advanced filter logic
So far, this article has discussed basic filter operations. You specify a column and criteria for whether rows should appear in your final report. As mentioned above, this kind of behaviour uses “AND” logic between your filters. By default, ItemPath will treat each filter as a separate filter group. A filter group is a collection of one or more filter criteria. From our previous example, each filter is in its own group:
- Group 1: Deviated Quantity is not 0.
AND - Group 2: Creation Date is after 1 week ago.
There may be times where you would like ItemPath to process your filters differently. For example, if you are working with a report that includes the Direction Type Description column, and you would like to filter your report to orders from a specific date range that are either picks or puts.
This logic would look like:
- Create Date is after 1 week ago.
- AND
- Direction Type Description is Pick OR Direction Type Description is Put
ItemPath handles this kind of logic in two ways, with filter groups and multiple values within a single filter.
Filter groups
You can change the group of a filter using the first textbox in the Data Filters display of the filters tab. This textbox allows you to specify a number to specify the filter’s group. After you Save, the filters will rearrange from the least to greatest group number.
If two filters share a filter group number, then they are in the same filter group. Filters in the same group will be processed with “OR” logic. The example from the start of this section would look like the following:
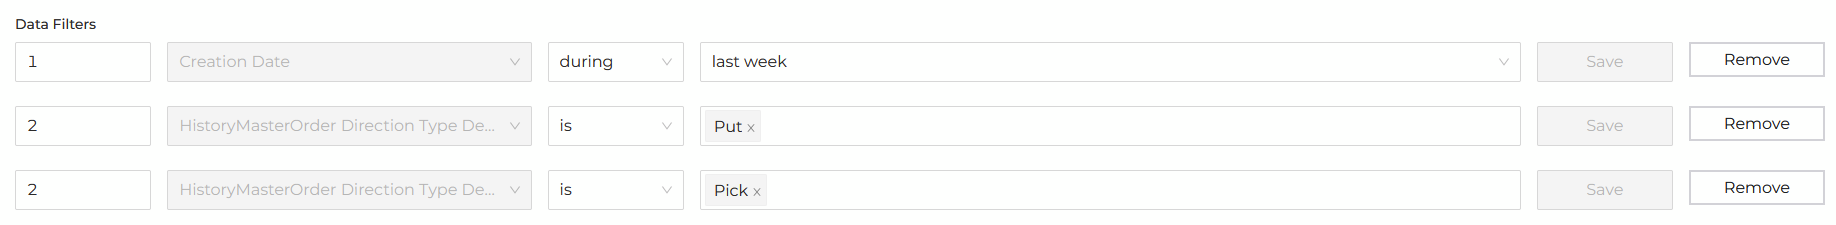
When the report is run, ItemPath will filter orders that meet both the creation date criteria and the conditions of filter group 2 (where the direction type description is "Pick" or "Put").
Note: One of the advantages of filter groups is that you can use “OR” logic between different columns, allowing for more complex logic.
Multiple values
You can also implement “OR” logic by adding multiple values to a single filter. For example, if you would like to filter transactions (in a History report) so that you’d only see transactions related to pick or put orders, you can do the following:
- Select the “Direction Type Description” column from the History Order table.
- Select “is” from the operation dropdown.
- Enter “Pick” into the “Enter a value” textbox. Press enter or select Pick from beneath your text input. “Pick” will appear in the textbox.
- Enter “Put” in the “Enter a value” textbox. You can do this by selecting the textbox and typing a second value. Press enter or select the value from the dropdown.
- Add your filter.

When a filter has multiple values, ItemPath will interpret this using “OR” logic. This example would evaluate as “Include a row if the order direction type description is either ‘Pick’ or ‘Put’“.
Filters and grouping
If you are familiar with query languages, you know that you can filter before or after grouping operations.
In ItemPath, report filters are always applied before column groupings, with one notable exception. If you include the row count for a column grouping, it can be filtered. This allows you to build reports that can trigger workflow based on row count.
For example: Suppose you’re building a report on error logs from the Data Pull app. You would like to know whether any integrations have had more than 500 errors in the current day. You can build this report with the following steps:
- Create a new report: select the “Log” theme, enter the name “Data Pull Integrations - Error Threshold Exceeded”.
- Add the following columns:
- App Name (from Log)
- Integration Name
- Error
- Creation Date (from Log)
- Select “Integration Name” as the primary column grouping.
- Select “Count” from the column type dropdown and label it as “Number of Errors”.
- Add the following filters:
- “Creation Date” is (during) today.
- “App Name” is “Data Pull”.
- “Error” is not “No Value”.
- “Number of Errors” is greater than “500”.
If you follow these instructions, the resulting filters will look like this:
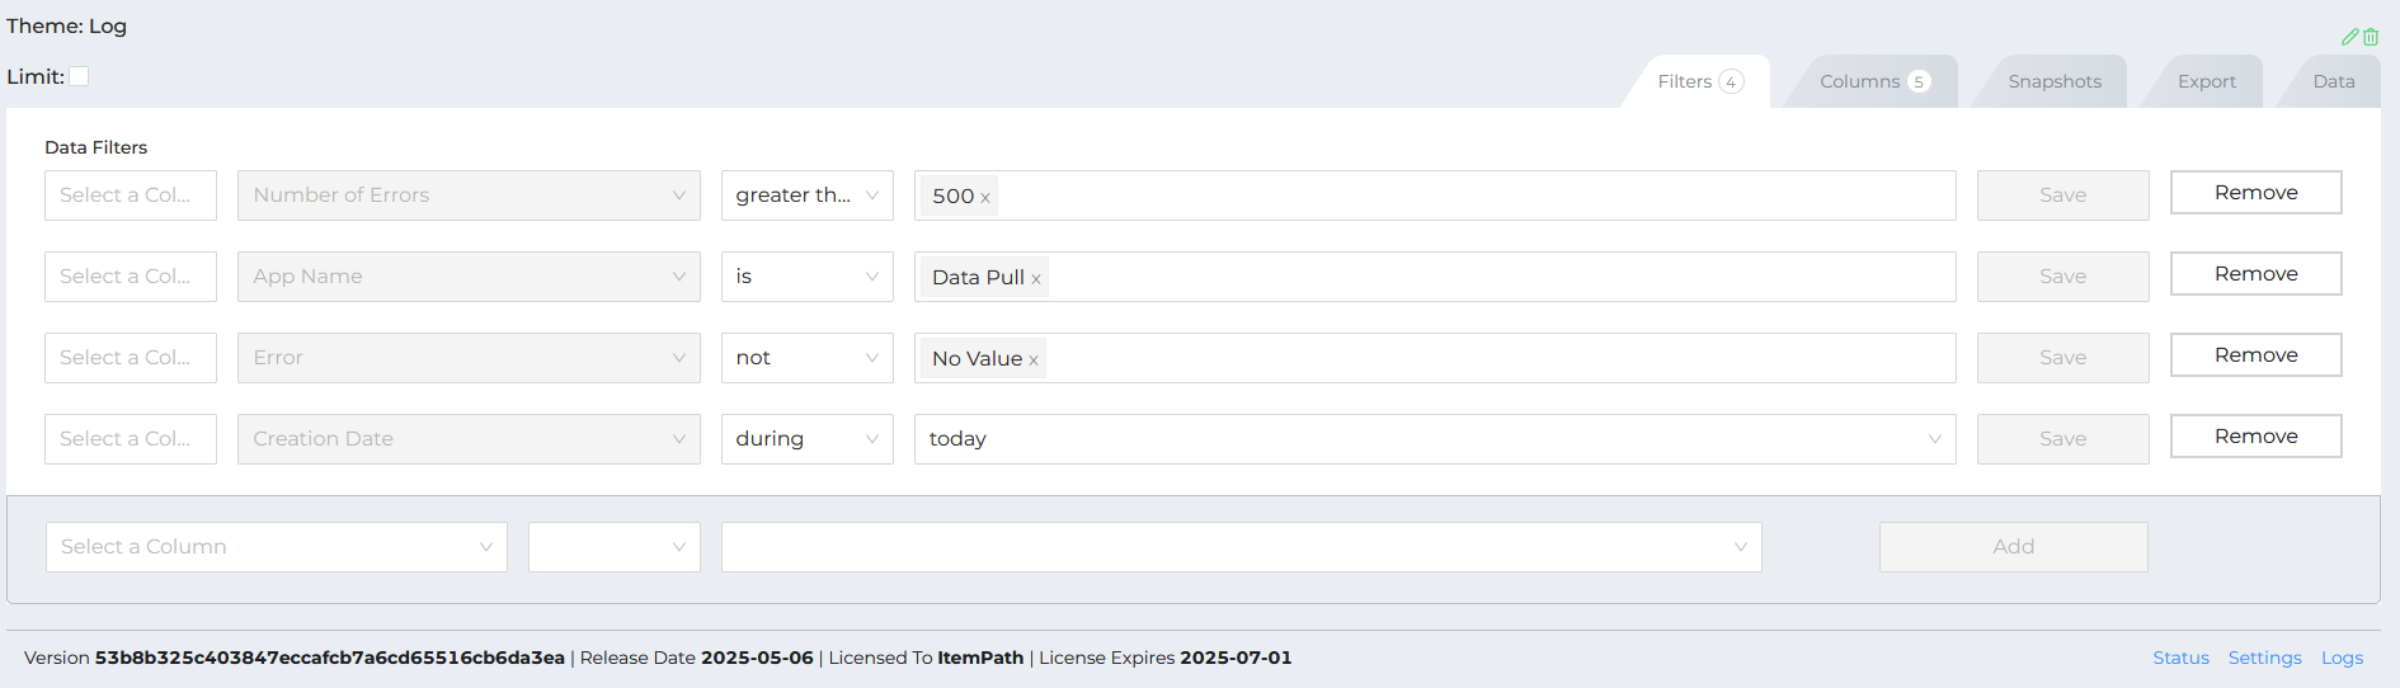
The resulting report might be empty, but this is a good sign! If there is data in this report, it means that an integration is triggering a significant number of errors. You can tie this report to a workflow that runs whenever this report includes data. If it does, the workflow can notify an administrator with an email or a slack message that an integration is failing.
Filter operations
The type of data in a column determines which filter operations are available. The following data types are available: strings, numeric (integers, floats), and date-times. Power Pick frequently uses integers to represent states that might be true or false, so boolean values are not included in our filter operations.
The tables in this section are a reference for the various filter types in ItemPath.
String operators
| Operator | Definition | Use case |
|---|---|---|
is | Selects records where the column’s text exactly matches the entered value. | Find a product with a specific name. |
not | Selects records where the column’s text doesn’t exactly match the entered value. | Exclude a specific category of items from a report. |
starts with | Selects records where the column’s text begins with the entered characters. | Find all orders with an ID that starts with “ORD-”. |
ends with | Selects records where the column’s text ends with the entered characters. | Identify orders with a specific suffix like “-MVI”. |
includes | Selects records where the column’s text contains the entered characters anywhere within it. | Find all Info1 fields that include the business unit “Dealership” |
excludes | Selects records where the column’s text doesn’t contain the entered characters anywhere within it. | Filter out error messages that contain a specific keyword. |
Numeric operators
| Operator | Definition | Use case |
|---|---|---|
Is | Selects records where the column’s number is exactly equal to the entered value. | Find all orders with a quantity of exactly 10. |
Not | Selects records where the column’s number isn’t equal to the entered value. | Exclude records with a 0 value in a specific metric. |
Greater than | Selects records where the column’s number is larger than the entered value. | Find all transactions with a quantity over 100. |
Less than | Selects records where the column’s number is smaller than the entered value. | Identify locations with inventory below a certain threshold. |
Date and time operators
Filters on date and time values have two layers of operators. You can choose the comparison operator, and specify the criteria through relative or absolute values.
Operators
| Operator | Definition | Use case |
|---|---|---|
During | Selects records where the date and time value falls within a specific relative date range, (such as today, this week, last year, etc.) | Specify orders from the last week. |
Before | Selects records where the date and time value is earlier than a specified date or time. | Identify transactions that happened before a certain cutoff point. |
After | Selects records where the date and time value is later than a specified date or time. | Find orders created or modified after a specific date. |
Ranges
If you use before or after as an operation, you can then specify an additional operation to help specify how you determine the range in the criteria. These can be relative to the date the report runs or an absolute value.
| Range | Relative or absolute | Definition | Use case |
|---|---|---|---|
specific date | Absolute | Allows you to enter a precise calendar date (YYYY-MM-DD). | Reporting on events that happened on a particular day range. |
specific time | Absolute | Allows you to enter a precise time of day (HH:MM). Can be combined with filters on specific dates. | Filtering logs for events that occurred at a specific range. |
years ago | Relative | Specifies a date range ending X number of years in the past from the current date. | Comparing data from the last few years. |
months ago | Relative | Specifies a date range ending X number of months in the past from the current date. | Generating monthly reports. |
weeks ago | Relative | Specifies a date range ending X number of weeks in the past from the current date. | Creating weekly summaries or tracking trends over the last few weeks. |
days ago | Relative | Specifies a date range ending X number of days in the past from the current date. | Monitoring daily activity or recent changes. |
hours ago | Relative | Specifies a time range ending X number of hours in the past from the current time. | Troubleshooting recent system issues. |
minutes ago | Relative | Specifies a time range ending X number of minutes in the past from the current time. | Real-time monitoring or very recent events. |
Tips for testing filters
There are often many equivalent ways of creating the same filters. Start by describing which rows you want to appear in your report, then think about how you could express the same idea using columns and operations. There are often equivalent ways using “not” and “OR” logic — so be careful with how you use complex logic when building your report.
It may help to select a row that you would like to see in your report (using Explorer) and think about whether it would pass your criteria individually. Verify that the expected row appears in your report data based on your defined criteria.
When building your reports, work with a limited collection of data. You can create records through the API that include features that make filtering easy (such as a unique string in the name of the order or a specific creation date). If you have a test environment, remember that you can create limited collections of test data there. Once you have created a report, you can use the ability to export and import report templates to bring reports from your test environment to production.