- Docs
- Variance Overview
- Create a Variance Report


-
Installation
-
Updating
-
Settings
-
Logs
-
API
-
Reports
-
Snapshots
-
Workflows
-
Dashboard
-
Explorer
-
Users
-
Resources
-
Custom Fields
-
Cycle Counts
-
Data Pull
-
Data Push
-
Displays
-
Lights (Philips Hue)
-
Order Builder
-
Order Processor
-
Variance
Create a Variance Report
After configuring your Variance integration and mappings, you're ready to begin building your Variance report. Prior to building out a Variance report, you will want to familiarize yourself with how ItemPath's reporting capabilities work. Variance reports can be used to provide data for widgets, which ultimately appear as part of your dashboards.
Remember that the Variance integration creates a table that joins data from an external source with data from Power Pick for the purposes of comparing the two datasets. A single Variance integration can be used in multiple Variance reports.
Variance Integrations and Report Columns
The first step in creating a report in ItemPath is to select a theme.
While Variance joins data from an external source, it does not have it's own theme inside of ItemPath's reporting engine. You will want to build a variance report using the same theme chosen for the Variance integration (e.g., Material or LocationContentBreakdown). You can then add columns using mappings from the Variance integration to find a column that you created in a previous step.
The most basic use case for a Variance report is to identify the difference in stock counts between two inventory systems. You can do this by constructing a simple comparison report:
- Navigate to the Reports tab in ItemPath.
- Select New Report
- Enter a name and select the theme for the report, then select Create Report.
- Add any columns from Power Pick that are used in the integration's join logic. These are required for the joins to be performed properly.
- Add any columns for the rest of the report that you require. Be sure to include the material quantity that you plan on comparing.
- Columns from your Variance integration are available in the "Select a Column..." drop down. Select Variance, then the column from the mappings set up in the Variance app. Note: Columns from any Variance integration will be available; the integration name is shown in round brackets following the column name. When you add the column to your report, the default name for the column will be "[Integration Name] [Column Name]".
- Set up a comparison column to display the difference between your two quantities:
- Select "Comparison" from the column dropdown.
- Select "Difference" as the comparison.
- Select the quantity column from your Variance integration as the first column.
- Select the appropriate Power Pick quantity column as the second compared column. Which column you should use is determined by how you configured the Variance join task - for example, you might use Material > Quantity.
- Enter a name for this column (e.g. "Variance").
- Select Add Column to save the column to your report.
- Add any additional columns to the report.
In the resulting report, any time the two inventory systems agree, they will have a value of 0 in the Variance column. Any time there is a negative value, the quantity of the material according to Power Pick is greater than the quantity according to your external system. Any time the value is positive, you will know that the quantity in Power Pick is less than the quantity according to your external system.
To limit your report results to variances only, add a filter on the Variance column to only show rows where the value is "not" "0".
You can use these values to do any of the following tasks, and more:
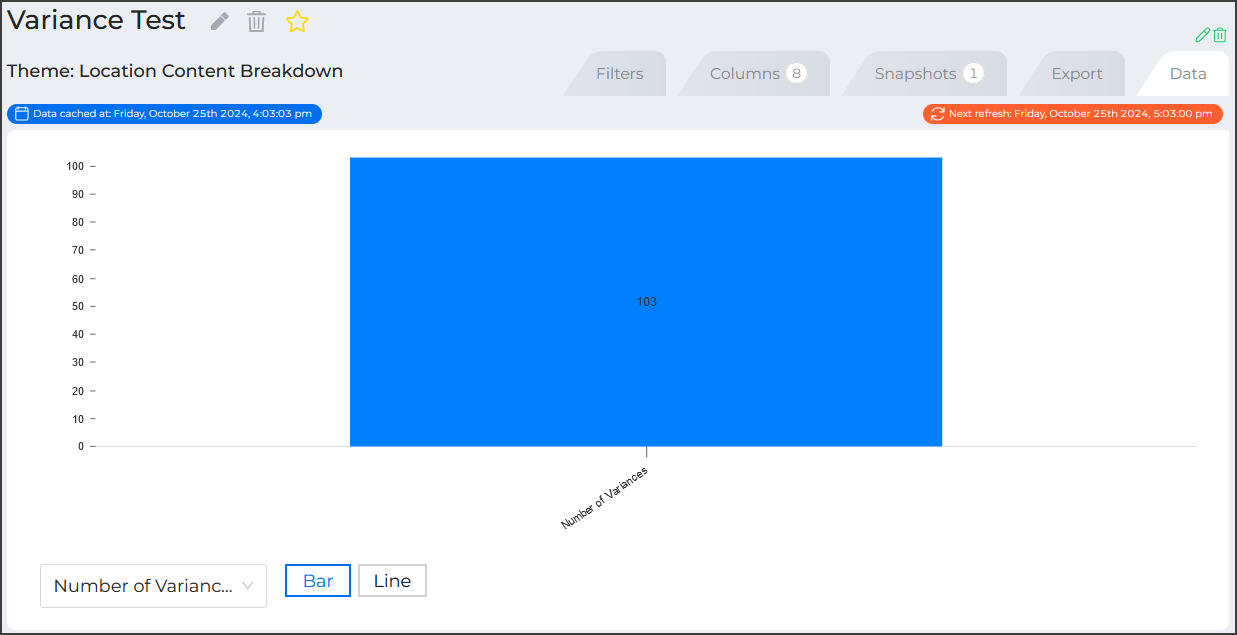
- Define snapshots, and create a widget to be aware of the overall number of Variances between the two systems.
- Define workflows to create emails or notifications for Variance quantities that are of a particular concern
Data Caching and Variance Reports
You may have configured your Variance integration to cache data at regular intervals. This information is displayed when you view your report data in two pill boxes above the body on your report. The date and time of the most recent cache will be displayed on the top-left. The next time the report will refresh with data from the external system is available to the top-right of your report. This information can help you schedule your report workflows to ensure that they reflect the most recent data.


