


Dashboard
Enhance your Power Pick system with visuals by building and sharing your own dashboard views.
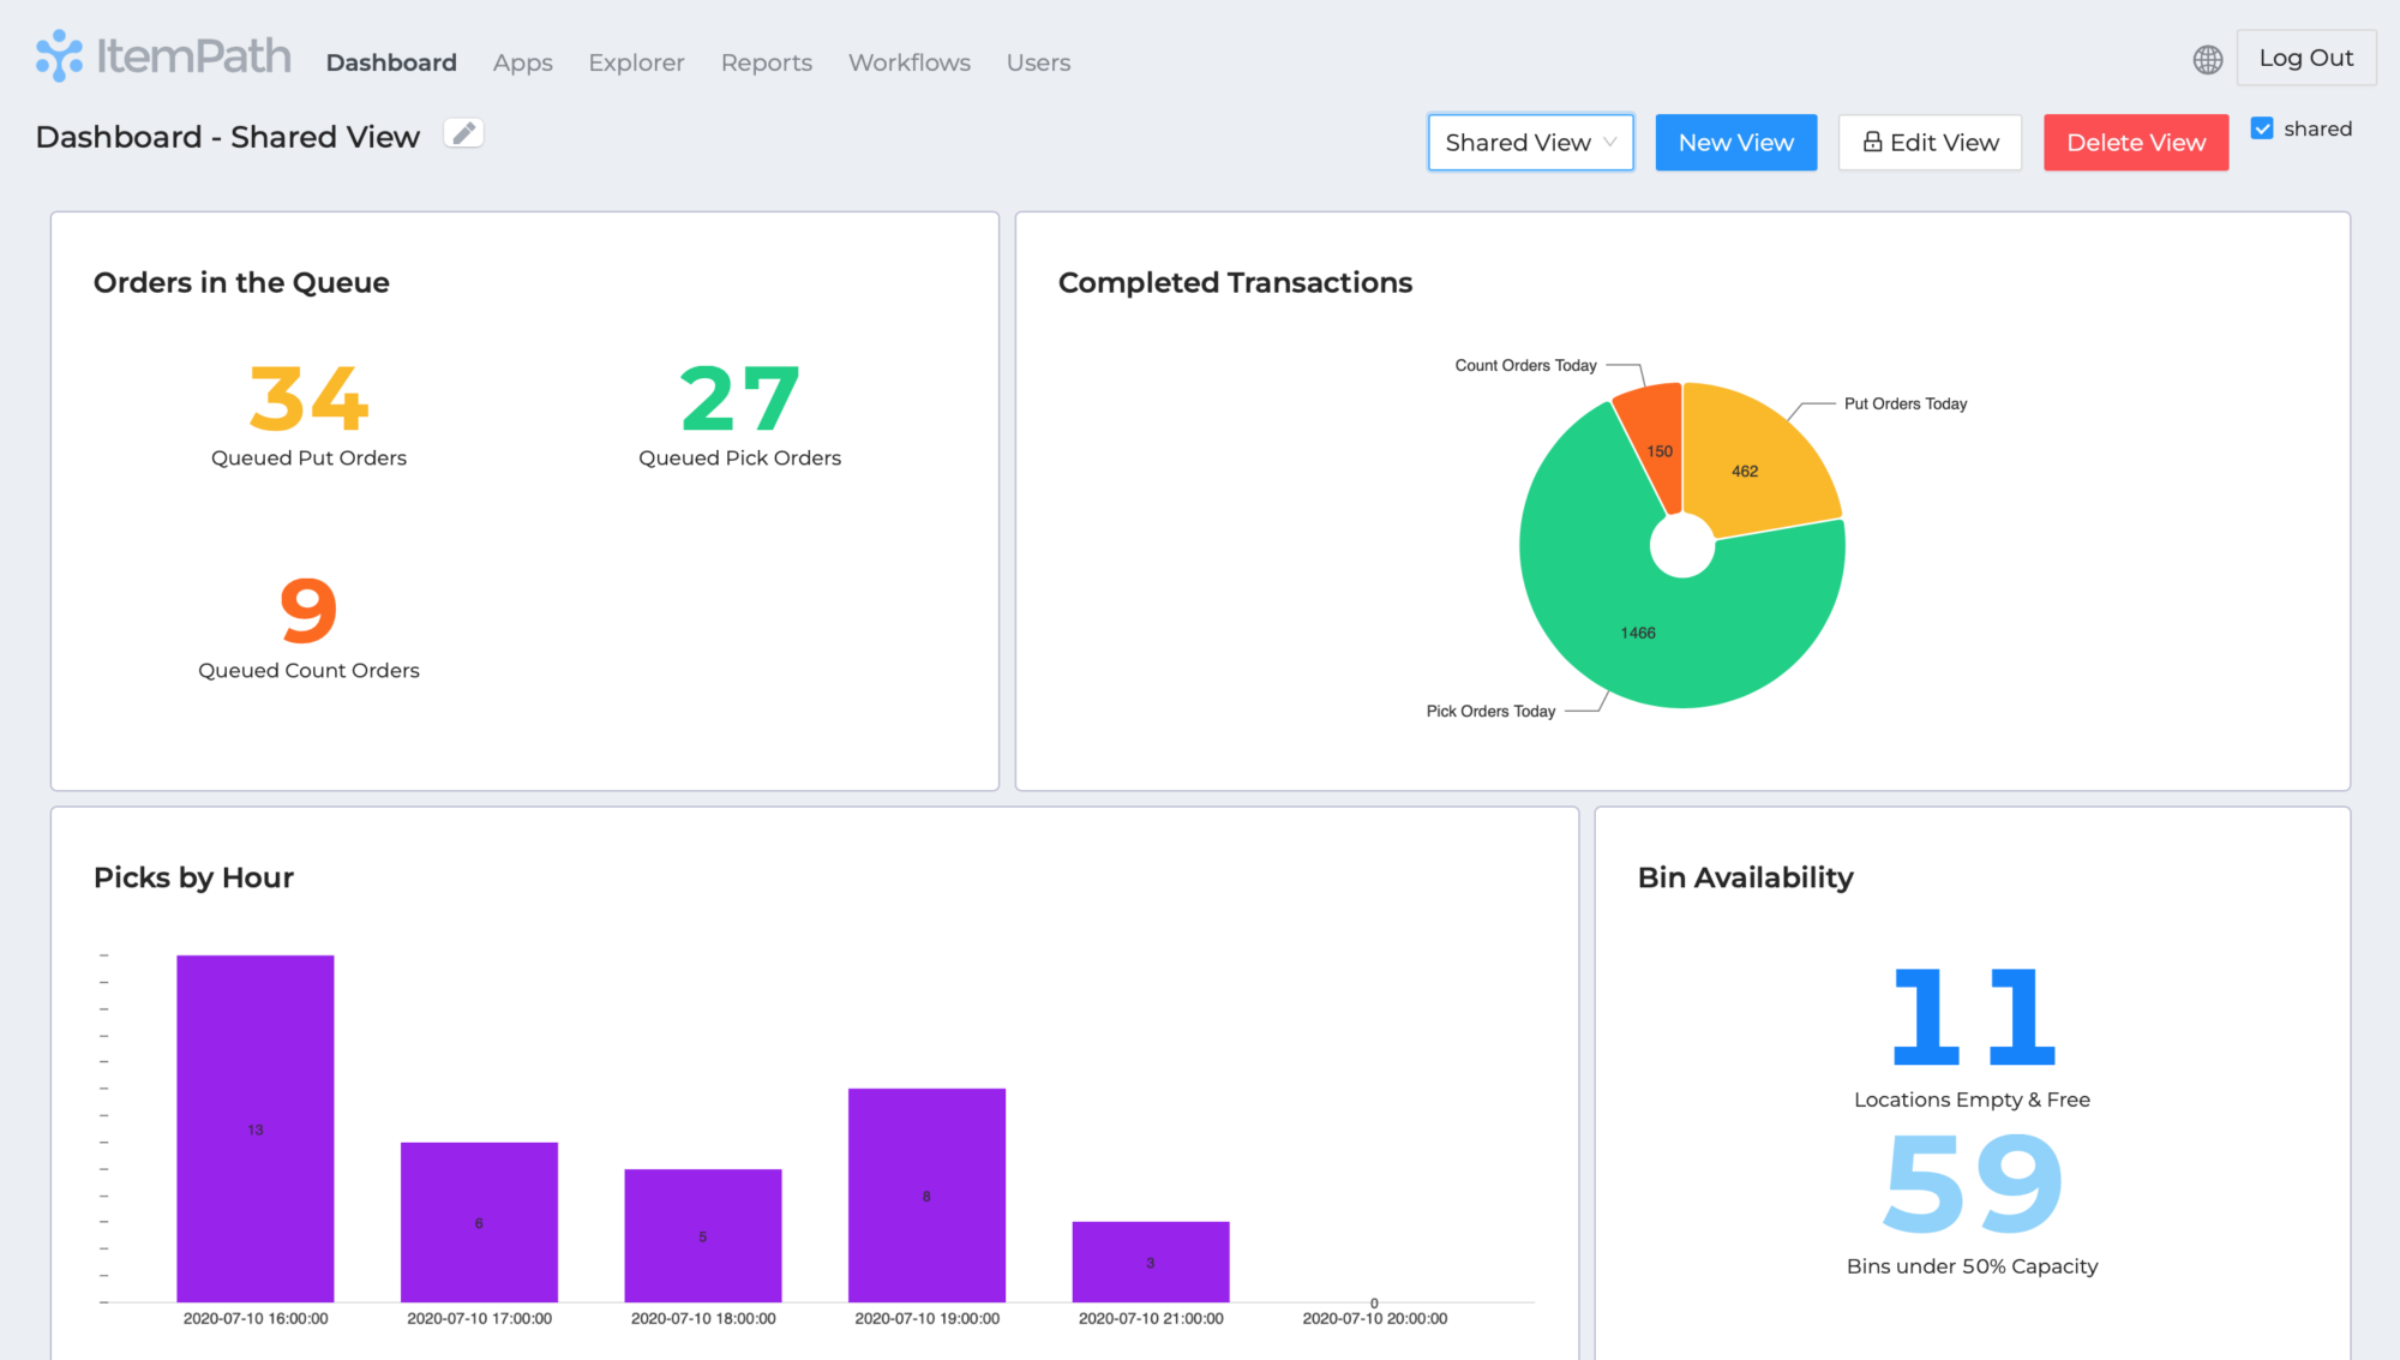
The ItemPath Dashboard shows more than you can see in Power Pick, by using report Snapshots to group data. This lets you build and present time-based information.
Add Widgets to your views that show current values or graphs over time of KPIs like:
- Picks per user per hour
- Count records per day
- Pick frequency (per hour, day,...) by Station, Storage Unit, Material, etc.
Users' ability to view, create, edit, and delete Dashboard views is determined by the permissions of their user role. You can even set user roles to be restricted to viewing the Dashboard only.
Building your dashboard requires a few steps: